Reproducibility of Cerebral Metabolite H T2 Relaxation Measurements at 3T
advertisement
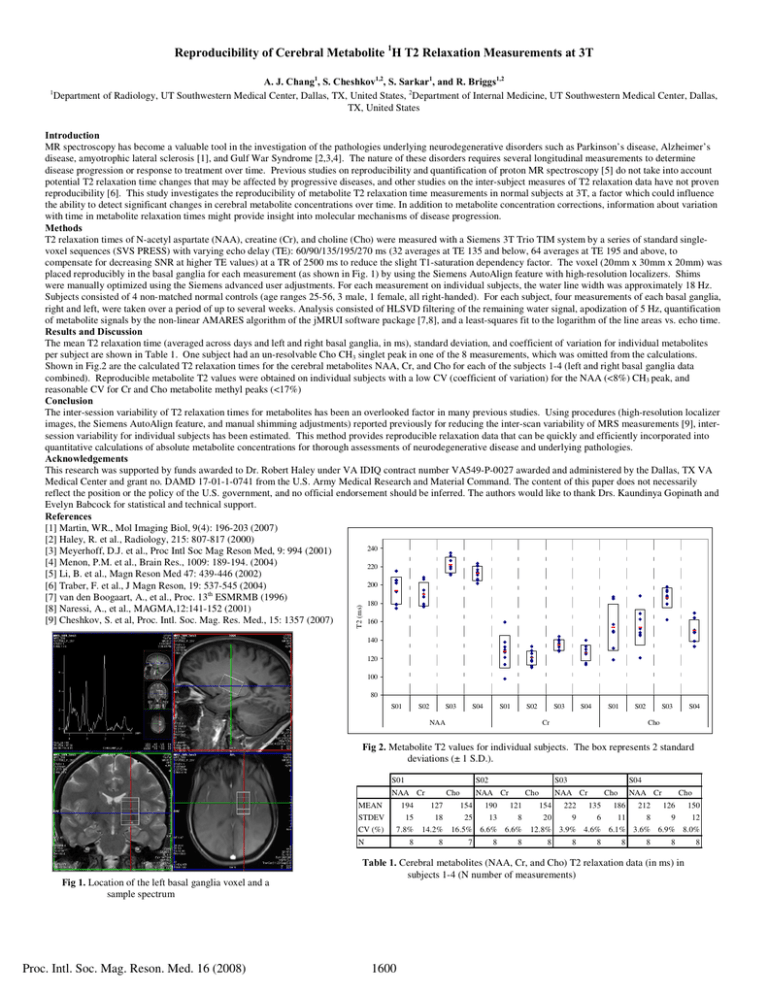
Reproducibility of Cerebral Metabolite 1H T2 Relaxation Measurements at 3T A. J. Chang1, S. Cheshkov1,2, S. Sarkar1, and R. Briggs1,2 Department of Radiology, UT Southwestern Medical Center, Dallas, TX, United States, 2Department of Internal Medicine, UT Southwestern Medical Center, Dallas, TX, United States 1 T2 (ms) Introduction MR spectroscopy has become a valuable tool in the investigation of the pathologies underlying neurodegenerative disorders such as Parkinson’s disease, Alzheimer’s disease, amyotrophic lateral sclerosis [1], and Gulf War Syndrome [2,3,4]. The nature of these disorders requires several longitudinal measurements to determine disease progression or response to treatment over time. Previous studies on reproducibility and quantification of proton MR spectroscopy [5] do not take into account potential T2 relaxation time changes that may be affected by progressive diseases, and other studies on the inter-subject measures of T2 relaxation data have not proven reproducibility [6]. This study investigates the reproducibility of metabolite T2 relaxation time measurements in normal subjects at 3T, a factor which could influence the ability to detect significant changes in cerebral metabolite concentrations over time. In addition to metabolite concentration corrections, information about variation with time in metabolite relaxation times might provide insight into molecular mechanisms of disease progression. Methods T2 relaxation times of N-acetyl aspartate (NAA), creatine (Cr), and choline (Cho) were measured with a Siemens 3T Trio TIM system by a series of standard singlevoxel sequences (SVS PRESS) with varying echo delay (TE): 60/90/135/195/270 ms (32 averages at TE 135 and below, 64 averages at TE 195 and above, to compensate for decreasing SNR at higher TE values) at a TR of 2500 ms to reduce the slight T1-saturation dependency factor. The voxel (20mm x 30mm x 20mm) was placed reproducibly in the basal ganglia for each measurement (as shown in Fig. 1) by using the Siemens AutoAlign feature with high-resolution localizers. Shims were manually optimized using the Siemens advanced user adjustments. For each measurement on individual subjects, the water line width was approximately 18 Hz. Subjects consisted of 4 non-matched normal controls (age ranges 25-56, 3 male, 1 female, all right-handed). For each subject, four measurements of each basal ganglia, right and left, were taken over a period of up to several weeks. Analysis consisted of HLSVD filtering of the remaining water signal, apodization of 5 Hz, quantification of metabolite signals by the non-linear AMARES algorithm of the jMRUI software package [7,8], and a least-squares fit to the logarithm of the line areas vs. echo time. Results and Discussion The mean T2 relaxation time (averaged across days and left and right basal ganglia, in ms), standard deviation, and coefficient of variation for individual metabolites per subject are shown in Table 1. One subject had an un-resolvable Cho CH3 singlet peak in one of the 8 measurements, which was omitted from the calculations. Shown in Fig.2 are the calculated T2 relaxation times for the cerebral metabolites NAA, Cr, and Cho for each of the subjects 1-4 (left and right basal ganglia data combined). Reproducible metabolite T2 values were obtained on individual subjects with a low CV (coefficient of variation) for the NAA (<8%) CH3 peak, and reasonable CV for Cr and Cho metabolite methyl peaks (<17%) Conclusion The inter-session variability of T2 relaxation times for metabolites has been an overlooked factor in many previous studies. Using procedures (high-resolution localizer images, the Siemens AutoAlign feature, and manual shimming adjustments) reported previously for reducing the inter-scan variability of MRS measurements [9], intersession variability for individual subjects has been estimated. This method provides reproducible relaxation data that can be quickly and efficiently incorporated into quantitative calculations of absolute metabolite concentrations for thorough assessments of neurodegenerative disease and underlying pathologies. Acknowledgements This research was supported by funds awarded to Dr. Robert Haley under VA IDIQ contract number VA549-P-0027 awarded and administered by the Dallas, TX VA Medical Center and grant no. DAMD 17-01-1-0741 from the U.S. Army Medical Research and Material Command. The content of this paper does not necessarily reflect the position or the policy of the U.S. government, and no official endorsement should be inferred. The authors would like to thank Drs. Kaundinya Gopinath and Evelyn Babcock for statistical and technical support. References [1] Martin, WR., Mol Imaging Biol, 9(4): 196-203 (2007) [2] Haley, R. et al., Radiology, 215: 807-817 (2000) 240 [3] Meyerhoff, D.J. et al., Proc Intl Soc Mag Reson Med, 9: 994 (2001) [4] Menon, P.M. et al., Brain Res., 1009: 189-194. (2004) 220 [5] Li, B. et al., Magn Reson Med 47: 439-446 (2002) 200 [6] Traber, F. et al., J Magn Reson, 19: 537-545 (2004) [7] van den Boogaart, A., et al., Proc. 13th ESMRMB (1996) 180 [8] Naressi, A., et al., MAGMA,12:141-152 (2001) [9] Cheshkov, S. et al, Proc. Intl. Soc. Mag. Res. Med., 15: 1357 (2007) 160 140 120 100 80 S01 S02 S03 S04 S01 S02 NAA S03 S04 S01 S02 Cr S03 S04 Cho Fig 2. Metabolite T2 values for individual subjects. The box represents 2 standard deviations (± 1 S.D.). S01 S02 NAA Cr Proc. Intl. Soc. Mag. Reson. Med. 16 (2008) S03 NAA Cr Cho S04 NAA Cr Cho NAA Cr Cho MEAN 194 127 154 190 121 154 222 135 186 212 126 150 STDEV 15 18 25 13 8 20 9 6 11 8 9 12 CV (%) 7.8% 14.2% 8 8 N Fig 1. Location of the left basal ganglia voxel and a sample spectrum Cho 16.5% 6.6% 6.6% 7 8 8 12.8% 3.9% 4.6% 6.1% 3.6% 6.9% 8.0% 8 8 8 8 8 8 Table 1. Cerebral metabolites (NAA, Cr, and Cho) T2 relaxation data (in ms) in subjects 1-4 (N number of measurements) 1600 8


