advertisement
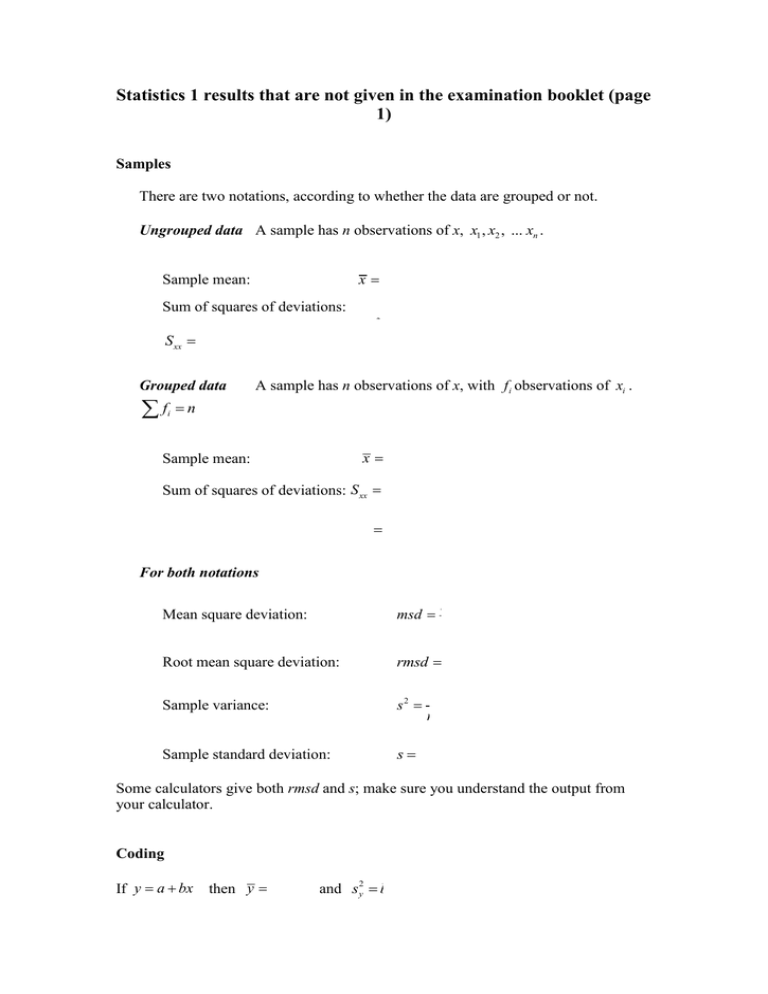
Statistics 1 results that are not given in the examination booklet (page 1) Samples There are two notations, according to whether the data are grouped or not. Ungrouped data A sample has n observations of x, x1 , x2 , ... xn . x Sample mean: x i n Sum of squares of deviations: S xx xi x x 2 Grouped data f i 2 i x 2 i n xi2 nx 2 A sample has n observations of x, with f i observations of xi . n Sample mean: x x f i i n 2 Sum of squares of deviations: S xx xi x f i x f 2 i i x f i i n 2 xi2 fi nx 2 For both notations S xx n Mean square deviation: msd Root mean square deviation: rmsd msd Sample variance: s2 Sample standard deviation: s s2 S xx n 1 Some calculators give both rmsd and s; make sure you understand the output from your calculator. Coding If y a bx then y a bx and s y2 b2 sx2 Statistics 1 results that are not given in the examination booklet (page 2) Selections and arrangements Number of ways of * arranging n unlike objects in line n! * selecting r objects from n unlike objects when the order does not n n! nCr matter r r ! n r ! selecting r objects from n unlike objects when order does matter n! n Pr n r ! * Conditional probability P( B A) P A B P A Discrete random variables [You will be given the formulae for finding the mean or expectation, E X , and the variance, Var( X ) , of X.] E a bX a bE X , Var a bX b2 Var X The binomial distribution For the binomial distribution, B n, p , the random variable, X, is the number of successes from n independent trials of a process for which P(success) p . P( X r ) nCr p r q nr for r 0,1, 2, ... , n where q 1 p . Statistics 1 results that are not given in the examination booklet (page 3) The binomial hypothesis test (A description of the process of hypothesis testing is given on page 18 of the Students’ Handbook.) Null hypothesis given H0: The probability of the underlying population, p, has a value Alternative hypotheses H1: p the given value (2-tail test) p the given value (1-tail test) or p the given value (1-tail test) or Test statistic Observed number of successes in a sample of size n trials Critical values tables Can be calculated, or derived from cumulative frequency
