Planck’s Constant from the PhotoElectric Effect G. Ihas
advertisement

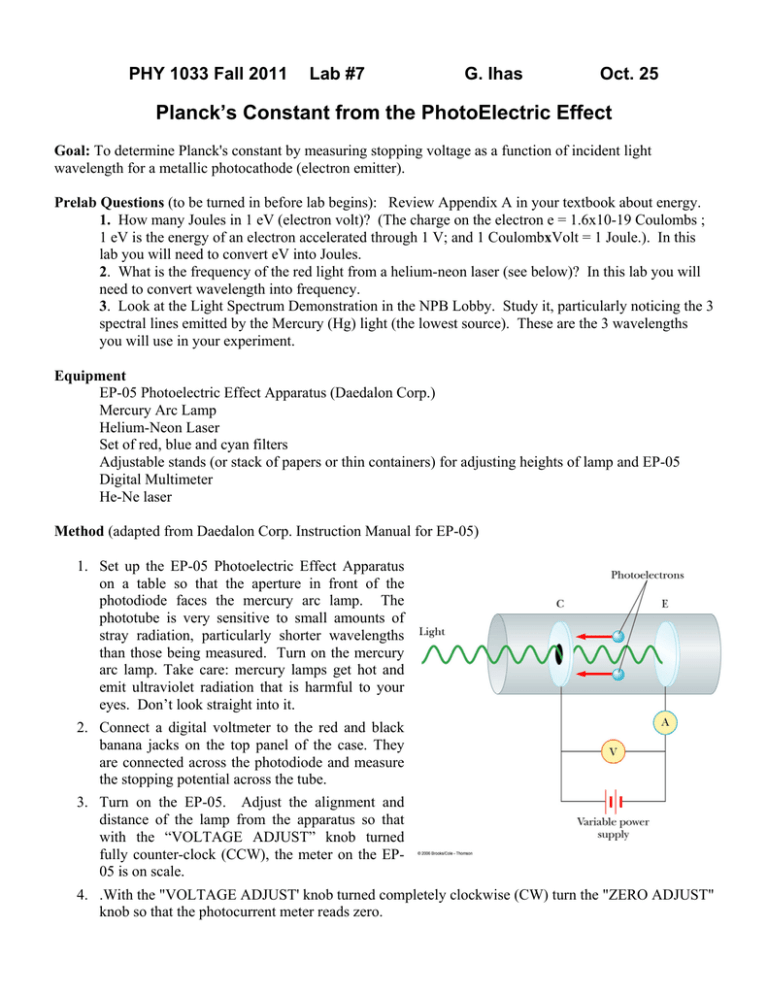
PHY 1033 Fall 2011 Lab #7 G. Ihas Oct. 25 Planck’s Constant from the PhotoElectric Effect Goal: To determine Planck's constant by measuring stopping voltage as a function of incident light wavelength for a metallic photocathode (electron emitter). Prelab Questions (to be turned in before lab begins): Review Appendix A in your textbook about energy. 1. How many Joules in 1 eV (electron volt)? (The charge on the electron e = 1.6x10⁻¹⁹ Coulombs ; 1 eV is the energy of an electron accelerated through 1 V; and 1 CoulombxVolt = 1 Joule.). In this lab you will need to convert eV into Joules. 2. What is the frequency of the red light from a helium-neon laser (see below)? In this lab you will need to convert wavelength into frequency. 3. Look at the Light Spectrum Demonstration in the NPB Lobby. Study it, particularly noticing the 3 spectral lines emitted by the Mercury (Hg) light (the lowest source). These are the 3 wavelengths you will use in your experiment. Equipment EP-05 Photoelectric Effect Apparatus (Daedalon Corp.) Mercury Arc Lamp Helium-Neon Laser Set of red, blue and cyan filters Adjustable stands (or stack of papers or thin containers) for adjusting heights of lamp and EP-05 Digital Multimeter He-Ne laser Method (adapted from Daedalon Corp. Instruction Manual for EP-05) 1. Set up the EP-05 Photoelectric Effect Apparatus on a table so that the aperture in front of the photodiode faces the mercury arc lamp. The phototube is very sensitive to small amounts of stray radiation, particularly shorter wavelengths than those being measured. Turn on the mercury arc lamp. Take care: mercury lamps get hot and emit ultraviolet radiation that is harmful to your eyes. Don’t look straight into it. 2. Connect a digital voltmeter to the red and black banana jacks on the top panel of the case. They are connected across the photodiode and measure the stopping potential across the tube. 3. Turn on the EP-05. Adjust the alignment and distance of the lamp from the apparatus so that with the “VOLTAGE ADJUST” knob turned fully counter-clock (CCW), the meter on the EP05 is on scale. 4. .With the "VOLTAGE ADJUST' knob turned completely clockwise (CW) turn the "ZERO ADJUST" knob so that the photocurrent meter reads zero. 5. Place the cyan filter over the photodiode aperture, white side out. This filter will pass the blue wavelength at λ = 405 nm. If the zero drifts between readings, the radiation intensity on the photo surface is too high and a phenomenon known as fatigue is occurring on the photo surface. Reduce the intensity by moving the source away from the aperture. The amplifier is quite stable but, since the measurement is made at the scale zero, any drift causes an error. The zero adjustment should be frequently checked during the measurements. Be careful not to hit or move any parts of the apparatus. 6. Watch the meter on the EP-05 as you carefully turn the VOLTAGE ADJUST knob CCW, until you just see the needle start to rise above the zero. This is the potential where you are first allowing photo-electrons to traverse the diode tube in the EP-05. As the voltage decreases, more and more electrons have enough energy to leave the cathode, and the current continues to rise. The value V you need is when the current just starts to rise as you adjust the potential CCW (down). Both you and you partner should measure the stopping voltage and record both readings, using the average in you final analysis. Record the values you obtain for the stopping voltage V in a table of filter color, wavelength, and stopping voltage in your lab notebook. Leave two extra columns—one for frequency of the light (calculated from the wavelength) and one for the stopping energy of the electrons (calculated from the voltage). 7. Change the filter, replacing the cyan filter with the blue one. This isolates the blue line in the mercury spectrum at λ = 436 nm and this will be the effective wavelength of the radiation passed through it. Repeat steps 5 and 6. You will find the stopping potential is smaller than for the previous wavelength. 8. Repeat step 7, for the following light sources: mercury lamp with red filter (wavelength = 670 nm); He-Ne laser (wavelength = 638 nm. We will use a diffuser to disperse the narrow laser beam. Analysis 1. Fill in the columns in your table, converting the wavelengths to frequency (f = c/) and volts to joules E = V * 1.6*10-19). Make sure your factors of 10 are correct and units are consistent. 2. Make a big graph of the energies (y axis) and frequencies (x axis). Since we are only determining the slope, the zero does not have to be on the graph. Construct your axes so that the values you measured mostly span a page in the lab notebook. 3. Use your eye and ruler to draw a straight line through all your data points (best fit). 4. Use the scale on your ruler to determine the SLOPE of your line—then use the scale on the graphs to convert this to the proper units (Joules/Hz). This is Planck’s Constant! Put this in a big box in your lab notebook with the proper units. 5. List all the reasons you think your value does not agree with the accepted value (or at least it probably doesn’t!).


