Document 10433753
advertisement
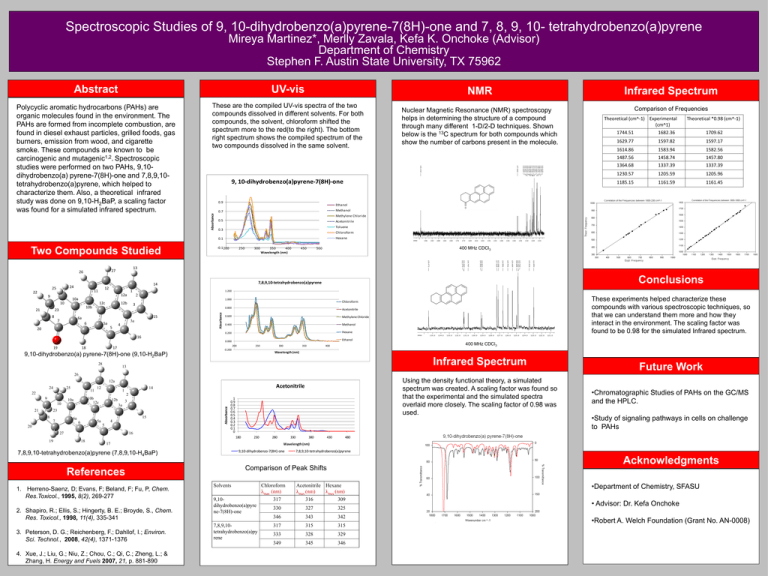
Spectroscopic Studies of 9, 10-dihydrobenzo(a)pyrene-7(8H)-one and 7, 8, 9, 10- tetrahydrobenzo(a)pyrene Mireya Martinez*, Merlly Zavala, Kefa K. Onchoke (Advisor) Department of Chemistry Stephen F. Austin State University, TX 75962 Abstract UV-vis NMR Infrared Spectrum Polycyclic aromatic hydrocarbons (PAHs) are organic molecules found in the environment. The PAHs are formed from incomplete combustion, are found in diesel exhaust particles, grilled foods, gas burners, emission from wood, and cigarette smoke. These compounds are known to be carcinogenic and mutagenic1,2. Spectroscopic studies were performed on two PAHs, 9,10dihydrobenzo(a) pyrene-7(8H)-one and 7,8,9,10tetrahydrobenzo(a)pyrene, which helped to characterize them. Also, a theoretical infrared study was done on 9,10-H2BaP, a scaling factor was found for a simulated infrared spectrum. These are the compiled UV-vis spectra of the two compounds dissolved in different solvents. For both compounds, the solvent, chloroform shifted the spectrum more to the red(to the right). The bottom right spectrum shows the compiled spectrum of the two compounds dissolved in the same solvent. Nuclear Magnetic Resonance (NMR) spectroscopy helps in determining the structure of a compound through many different 1-D/2-D techniques. Shown below is the 13C spectrum for both compounds which show the number of carbons present in the molecule. Comparison of Frequencies 9, 10-dihydrobenzo(a)pyrene-7(8H)-one 0.9 Absorbance 0.5 10a 10 21 8 12c 12b 5a 20 250 300 350 400 Wavelength (nm) 450 18 1582.56 1487.56 1458.74 1457.80 1364.68 1337.39 1337.39 1230.57 1205.59 1205.96 1185.15 1161.59 1161.45 400 MHz CDCl3 500 Conclusions 7,8,9,10-tetrahydrobenzo(a)pyrene 0.800 Acetonitrile 0.600 Methylene Chloride 0.400 Methanol 0.200 Hexane 0.000 Ethanol 200 17 250 -0.200 300 350 400 MHz CDCl3 400 Wavelength (nm) 9,10-dihydrobenzo(a) pyrene-7(8H)-one (9,10-H2BaP) 28 These experiments helped characterize these compounds with various spectroscopic techniques, so that we can understand them more and how they interact in the environment. The scaling factor was found to be 0.98 for the simulated Infrared spectrum. Chloroform 16 19 1583.94 Hexane -0.1 200 3 3a 4 5 1614.86 1.200 15 6a 6 1597.17 Chloroform 2 10b 7 1597.82 Toluene 1.000 23 1629.77 Acetonitrile 0.3 1 12a 9 1709.62 Methylene Chloride Absorbance 22 12 11 1682.36 Methanol 0.7 14 24 25 1744.51 13 27 26 Theoretical *0.98 (cm^-1) Ethanol 0.1 Two Compounds Studied Theoretical (cm^-1) Experimental (cm^1) Infrared Spectrum 13 Future Work 26 Using the density functional theory, a simulated spectrum was created. A scaling factor was found so that the experimental and the simulated spectra overlaid more closely. The scaling factor of 0.98 was used. 12a 24 25 11 22 12 Acetonitrile 14 1 2 10b 12c 10a 10 21 12b 3 3a 23 8 15 6a 7 5a 6 4 5 20 27 16 Absorbance 9 1 0.9 0.8 0.7 0.6 0.5 0.4 0.3 0.2 0.1 0 180 19 18 230 280 17 9,10-dihydrobenzo-7(8H)-one 3. Peterson, D. G.; Reichenberg, F.; Dahllof, I.; Environ. Sci. Technol., 2008, 42(4), 1371-1376 4. Xue, J.; Liu, G.; Niu, Z.; Chou, C.; Qi, C.; Zheng, L.; & Zhang, H. Energy and Fuels 2007, 21, p. 881-890 430 480 7,8,9,10-tetrahydrobenzo(a)pyrene Acknowledgments Comparison of Peak Shifts References 2. Shapiro, R.; Ellis, S.; Hingerty, B. E.; Broyde, S., Chem. Res. Toxicol., 1998, 11(4), 335-341 380 •Study of signaling pathways in cells on challenge to PAHs Wavelength (nm) 7,8,9,10-tetrahydrobenzo(a)pyrene (7,8,9,10-H4BaP) 1. Herreno-Saenz, D; Evans, F; Beland, F; Fu, P, Chem. Res.Toxicol., 1995, 8(2), 269-277 330 •Chromatographic Studies of PAHs on the GC/MS and the HPLC. Solvents 9,10dihydrobenzo(a)pyre ne-7(8H)-one 7,8,9,10tetrahydrobenzo(a)py rene Chloroform λmax (nm) Acetonitrile Hexane λmax (nm) λmax (nm) 317 316 309 330 327 325 346 343 342 317 315 315 333 328 329 349 345 346 •Department of Chemistry, SFASU • Advisor: Dr. Kefa Onchoke •Robert A. Welch Foundation (Grant No. AN-0008)

