APM 635. MULTIVARIATE STATISTICAL METHODS
advertisement
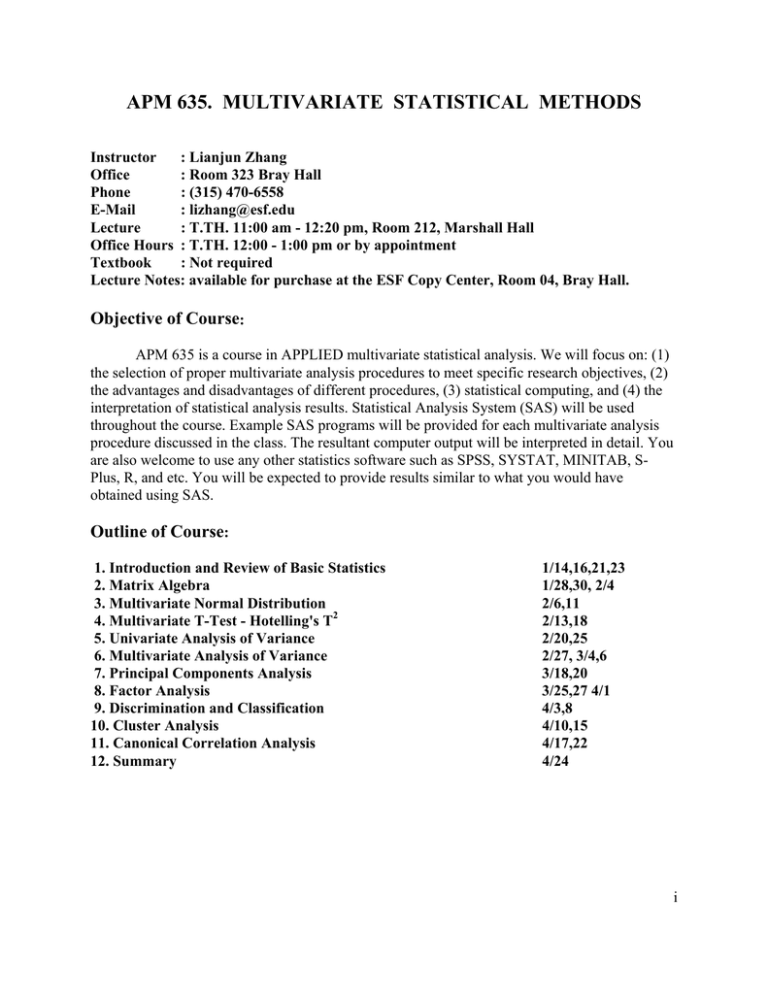
APM 635. MULTIVARIATE STATISTICAL METHODS Instructor : Lianjun Zhang Office : Room 323 Bray Hall Phone : (315) 470-6558 E-Mail : lizhang@esf.edu Lecture : T.TH. 11:00 am - 12:20 pm, Room 212, Marshall Hall Office Hours : T.TH. 12:00 - 1:00 pm or by appointment Textbook : Not required Lecture Notes: available for purchase at the ESF Copy Center, Room 04, Bray Hall. Objective of Course: APM 635 is a course in APPLIED multivariate statistical analysis. We will focus on: (1) the selection of proper multivariate analysis procedures to meet specific research objectives, (2) the advantages and disadvantages of different procedures, (3) statistical computing, and (4) the interpretation of statistical analysis results. Statistical Analysis System (SAS) will be used throughout the course. Example SAS programs will be provided for each multivariate analysis procedure discussed in the class. The resultant computer output will be interpreted in detail. You are also welcome to use any other statistics software such as SPSS, SYSTAT, MINITAB, SPlus, R, and etc. You will be expected to provide results similar to what you would have obtained using SAS. Outline of Course: 1. Introduction and Review of Basic Statistics 2. Matrix Algebra 3. Multivariate Normal Distribution 4. Multivariate T-Test - Hotelling's T2 5. Univariate Analysis of Variance 6. Multivariate Analysis of Variance 7. Principal Components Analysis 8. Factor Analysis 9. Discrimination and Classification 10. Cluster Analysis 11. Canonical Correlation Analysis 12. Summary 1/14,16,21,23 1/28,30, 2/4 2/6,11 2/13,18 2/20,25 2/27, 3/4,6 3/18,20 3/25,27 4/1 4/3,8 4/10,15 4/17,22 4/24 i Reference: Healy. 1986. Matrices for statistics. Oxford. Neter, Wasserman, and Kutner. 1996. Applied linear regression models. IRWIN. Manly. 1986. Multivariate statistical methods: A primer. Chapman & Hall. Johnson & Wichern. 1998. Applied multivariate statistical analysis. 4th Ed. Prentice Hall. Hair et al. 1998. Multivariate data analysis. 5th Ed. Prentice Hall. Evaluation: Your progress will be evaluated by the following weights: Quizzes Homeworks 10% 90% Note: 1. There will be 5 random and unannounced quizzes during the semester (simple and open notes). 2. There are 10 HW assignments. Homework usually requires statistical analysis and interpretation of the results. You may work with other students on statistical computing and discussion of potential solutions. You are expected to submit your own report for the analysis results. Copying the report from each other is NOT acceptable. 3. Late HW will be penalized 10 points for each week passing the due date. 4. HW 3 - 10 requires you to write a project report up to 10 typed pages long (single space), which should include (1) introduction, purpose, and description of the study and data sets, (2) step-by-step analysis methods, (3) models, analysis results and discussion, including necessary tables and graphics, and (4) summary. Attach your SAS programs as the appendix. Stacking selected SAS output without sufficient explanation would not be considered as a report. An incomplete report that does not follow the reporting requirements will have a 10 points reduction. Grading System: Your final grade will be determined as follows: 95 - 99 90 - 94 85 - 89 80 - 84 75 - 79 < 75 = = = = = = A AB+ B BF Good Luck! ii
