Solutions to Suggested Problems 6.21 n = 6
advertisement

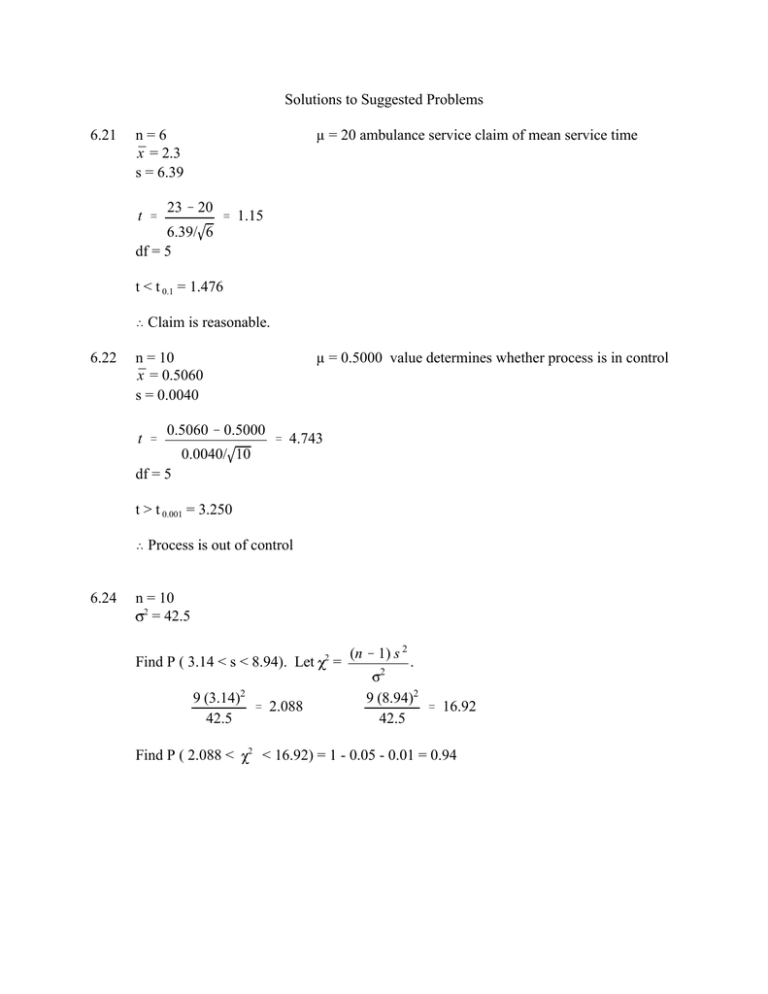
Solutions to Suggested Problems 6.21 n=6 x̄ = 2.3 s = 6.39 t ' µ = 20 ambulance service claim of mean service time 23 & 20 ' 1.15 6.39/ 6 df = 5 t < t 0.1 = 1.476 í Claim is reasonable. 6.22 n = 10 x̄ = 0.5060 s = 0.0040 t ' µ = 0.5000 value determines whether process is in control 0.5060 & 0.5000 ' 4.743 0.0040/ 10 df = 5 t > t 0.001 = 3.250 í Process is out of control 6.24 n = 10 2 = 42.5 Find P ( 3.14 < s < 8.94). Let 9 (3.14)2 ' 2.088 42.5 Find P ( 2.088 < 2 2 = (n & 1) s 2 2 . 9 (8.94)2 ' 16.92 42.5 < 16.92) = 1 - 0.05 - 0.01 = 0.94 7.4 n = 50 x̄ = 11,795 s = 14,054 = 0.05 maximum error (E) estimate: E = | x̄ - µ| < z 0.05 14,054 ' 1.960 50 2 14,054 ' 3,896 with 95% confidence 50 7.5 Confidence interval: ( x̄ - E, x̄ + E) = (11,795 - 3,896, 11,795 + 3,896) with 95% confidence. 7.6 n = 40 x̄ = 12.73 s = 2.06 a) = 0.01 maximum error (E) estimate: E = | x̄ - µ| < z 0.01 2 b) 2.06 ' 2.576 40 2.06 ' 0.84 with 99% confidence 40 = 0.02 E2 = | x̄ - µ| < z 0.02 2.06 2 40 ' 2.326 2.06 ' 0.76 with 98% confidence 40 Confidence interval: ( x̄ - E2 , x̄ + E2 ) = (12.73- 0.76, 12.73 +0.76) with 98% confidence. 7.7 E = 0.5 min. 2.06 E = | x̄ - µ| < z 2 ' 0.5 40 /2 = 1 - 0.9376 = 0.0624 ' z 2 0.5 40 ' 1.535 2.06 = 0.1248 Confidence level = 1 - 0.1248 = 0.8752 that maximum error is 0.5 min. 7.9 n = 80 x̄ = 472.36 s = 62.35 62.35 E = | x̄ - µ| < z 2 ' 10 ' z 80 2 /2 = 1 - 0.9243 = 0.0757 10 80 ' 1.435 62.35 = 0.1514 Confidence level = 1 - 0.1514 = 0.8486 that maximum error is 10. 7.12 = 60 1 - = 0.9 E = 10 E = | x̄ - µ| < z 0.1 2 n $ 7.24 60 # 10 1.645 n # 10 n 1.645 (60) 10 n=8 60 n $ 97.4 E1 = | x̄ - µ| < t 0.05 2 0.54 8 ' 2.365 0.54 ' 0.45 with 98% 8 confidence x̄ = 2.1 s = 0.54 Confidence interval ( x̄ - E1 , x̄ + E1 ) = (2.1 - 0.45, 2.1 + 0.45) with 95% confidence. 1 - = 0.95 df = 7 7.27 a) Erroneously rejecting the null hypothesis that the dam was safe would cause unneeded renovation and/or repairs. b) Erroneously accepting the null hypothesis that the dam was safe would cause loss of property and/or life. 7.30 µ = 3.0000 = 0.0250 a) H0 : H1 : µ = 3.0000 µ ú 3.0000 n = 30 H0 will be rejected if | x̄ - µ| > 0.0040 |z| = |x̄&µ| 0.0040 ' ' 1.012 0.0250/ 30 / n P ( |z| > 1.012 ) = 2 P ( z > 1.012 ) = 2 (1 - 0.8670) = 0.2660 b) n = 30 Find P (x < 2.9960) + P(x > 3.0040) if µ = 3.0050 prevails za = 2.9960&3.0050 ' &1.972 0.0250 / 30 zb= 3.0040&3.0050 ' &0.219 0.0250 / 30 Find P (z < z a ) + P (z > z b) = 0.02433 + 1 - 0.4125 = 0.6118 7.32 µ = 100 = 12 n = 40 = 0.01 Find x̄0 so that P (x > x̄0 ) = 0.01. Let z a = x̄0 & µ / n ' x̄0 & 100 12/ 40 P (z > z a) = 0.01 is equivalent to z a > z0.01 = 2.326. Hence x̄0 > 100 + 2.326 12 40 = 100 + 4.41. . 7.39 n = 45 x̄ = 76.7 µ = 73.2 = 8.6 = 0.01 ✑ ✒ ✓ H0 : H1 : µ = 7.32 µ > 73.2 = 0.01 z= x̄ & µ Critical value: z = 2.326 / n ✔ 76.7 & 73.2 ' 2.730 8.6/ 45 ✕ Reject H0. The data provides sufficient evidence that mean aptitude score is more than 73.2. 7.40 n = 35 x̄ = 1.4707 s = 0.5235 µ = 1.3 = 0.05 ✑ ✒ ✓ H0 : H1 : µ = 1.3 µ > 1.3 = 0.05 z= x̄ & µ Critical value: z = 1.645 / n ✔ 1.4707 & 1.3 ' 1.929 0.5325/ 35 ✕ Reject H0. The data provides sufficient evidence that mean cost is more than 1.3 (thousands). 7.41 n = 64 x̄ = 1,038 s = 146 µ = 1,000 = 0.05 ✑ ✒ ✓ H0 : H1 : µ = 1000 µ > 1000 = 0.05 x̄ & µ z= Critical value: z = 1.645 / n ✔ 1,038 & 1,000 ' 2.08 146/ 64 ✕ Reject H0. The data provides sufficient evidence that mean number of acceptable pieces is more than 1,000. 7.43 n = 60 x̄ = 33.8 s = 6.1 µ = 32.6 = 0.05 ✑ ✒ ✓ H0 : H1 : µ = 32.6 µ > 32.6 = 0.05 z= x̄ & µ Critical value: z = 1.645 / n ✔ 33.8 & 32.6 ' 1.52 6.1/ 60 ✕ Fail to reject H0. The data does not provide sufficient evidence that mean travel time is more than 32.6 minutes. 7.44 n=6 x̄ = 58,392 s = 648 µ = 58,000 = 0.05 ✑ ✒ ✓ H0 : H1 : µ = 58,000 µ ú 58,000 = 0.05 t= x̄ & µ Critical value: t /2 = 2.571 s/ n df = 5 ✔ 58,392 & 58,000 ' 1.481 648/ 5 ✕ Fail to reject H0. The data does not provide sufficient evidence that mean compressive strength is not than 58,000 psi. 7.48 n=5 x̄ = 14.4 s = 0.158 µ = 14.0 = 0.05 ✑ ✒ ✓ H0 : H1 : µ = 14.0 µ > 14.0 = 0.05 t= x̄ & µ Critical value: t = 2.132 s/ n df = 4 ✔ 14.4 & 14.0 ' 5.660 0.158/ 4 ✕ Reject H0. The data provides sufficient evidence that mean tar content is more than 14.0. 7.49 n=5 x̄ = 14.7 s = 0.742 µ = 14.0 = 0.05 ✑ ✒ ✓ H0 : H1 : µ = 14.0 µ > 14.0 = 0.05 t= x̄ & µ Critical value: t = 2.132 s/ n df = 4 ✔ 14.7 & 14.0 ' 2.109 0.742/ 4 ✕ Fail to reject H0. The data does not provide sufficient evidence that mean tar content is more than 14.0. The increase in the standard deviation allows for more variability in the population data. 7.63 µ 1 = 0.249 1 = 0.003 µx 1 & x2 x1 & x2 µ 2 = 0.255 2 = 0.002 ' µ 1 & µ 2 ' &0.006 ' 2 1 % 2 2 ' 0.003605 P( x1 - x2 < 0 ) = P( z < 0 & (&0.006) ) = P (z < 1.664) = 0.9519 0.003605 7.64 n1 = 71 x̄1 = 83.2 n2 = 75 x̄2 = 90.8 s1 = 19.3 s2 = 21.4 = 0.05 (a) ✑ ✒ ✓ H0 : H1 : µ1 = µ2 µ1 ú µ2 = 0.05 z= (x̄1 & x̄2) & (0) Critical value: -z /2 = -1.960 x̄1 & x̄2 x̄1 & x̄2 ✔ ✕ 2 1 ' n1 % 2 2 n2 ' 19.32 21.42 % ' 3.369 71 75 (83.2 & 90.8) & 0 ' &2.2558 3.369 Reject H0. The data provides sufficient evidence that the two population means are different. (b) ' d= 2 1 % 2 2 |µ 1 & µ 2| ' ' 19.32 % 21.42 ' 28.81 |0 & (&12)| ' 0.416 28.81 From Table 8 (c) the probability of failing to reject the null hypothesis when µ 1 - µ 2 = -12 prevails is 0. 7.65 n1 = 60 x̄1 = 292.5 n2 = 60 x̄2 = 266.1 s1 = 15.6 s2 = 18.2 = 0.01 ✑ ✒ ✓ H0 : H1 : µ 1 - µ 2 = 20 µ 1 - µ 2 > 20 = 0.01 z= (x̄1 & x̄2) & (20) Critical value: z = 2.326 x̄1 & x̄2 x̄1 & x̄2 ✔ ✕ ' 2 1 n1 % 2 2 n2 ' 15.62 18.22 % ' 3.095 71 75 (292.5 & 266.1) & 20 ' 2.068 3.095 Fail to reject H0. The data does not provide sufficient evidence that the mean weekly salaries for men are $20 more than the mean weekly salaries for women. 7.67 n1 = 8 x̄1 = 9.67 n2 = 10 x̄2 = 7.43 s1 = 1.81 s2 = 1.48 1 = 2 = = 0.05 ✑ ✒ ✓ H0 : H1 : µ 1 - µ 2 = 1.5 µ 1 - µ 2 > 1.5 = 0.05 t= (x̄1 & x̄2) & (1.5) sp Critical value: t = 1.746 1 1 % n1 n2 df = 16 2 2 sp ✔ ' n1 % n2 & 2 (9.67 & 7.43) & 1.5 1.633 ✕ 2 (n1 & 1) s1 % (n2&1) s2 ' 7(1.81)2 % 9(1.48)2 ' 2.665 16 ' 0.9556 1 1 % 8 10 Fail to reject H0. The data does not provide sufficient evidence that the mean deniers from the two spinning machines differ by more than 1.5. 7.68 n1 = 10 x̄1 = 70 n2 = 10 x̄2 = 74 s1 = 3.37 s2 = 5.40 = 1 2 = = 0.05 ✑ ✒ ✓ H0 : H1 : µ1 = µ2 µ1 < µ2 = 0.05 t= (x̄1 & x̄2) & (0) Critical value: -t = -1.734 1 1 % n1 n2 sp df = 18 2 2 sp ✔ ' ✕ n1 % n2 & 2 (70 & 74) & 0 4.50 2 (n1 & 1) s1 % (n2&1) s2 ' 9(3.37)2 % 9(5.40)2 ' 20.258 18 ' &1.9876 1 1 % 10 10 Reject H0. The data provides sufficient evidence that the training under Method B is more effective. 7.69 n1 = 9 x̄1 = 58 n2 = 6 x̄2 = 51.8 s1 = 10.4 s2 = 12.7 1 = 2 = = 0.01 ✑ ✒ ✓ H0 : H1 : µ1 = µ2 µ1 ú µ2 = 0.01 t= (x̄1 & x̄2) & (1.5) sp Critical value: t /2 = 3.012 1 1 % n1 n2 df = 13 2 2 sp ✔ ' ✕ n1 % n2 & 2 (58 & 51.8) & 0 11.34 2 (n1 & 1) s1 % (n2&1) s2 ' 8(10.4)2 % 5(12.7)2 ' 128.594 13 ' 1.037 1 1 % 9 6 Fail to reject H0. The data does not provide sufficient evidence that the means from the two populations are different. 7.71 n = 10 d̄ = -0.02 sd = 0.0287 = 0.05 ✑ ✒ ✓ d̄ = 0 d̄ ú 0 H0 : H1 : = 0.05 t= d̄ & 0 Critical value: -t /2 = -2.262 sd / n df = 9 ✔ &0.02 & 0 ' &2.2059 0.0287/ 10 ✕ Fail to reject H0. The data does not provide sufficient evidence that the two scales weigh differently.


