Upper Grand District School Board Program Services
advertisement
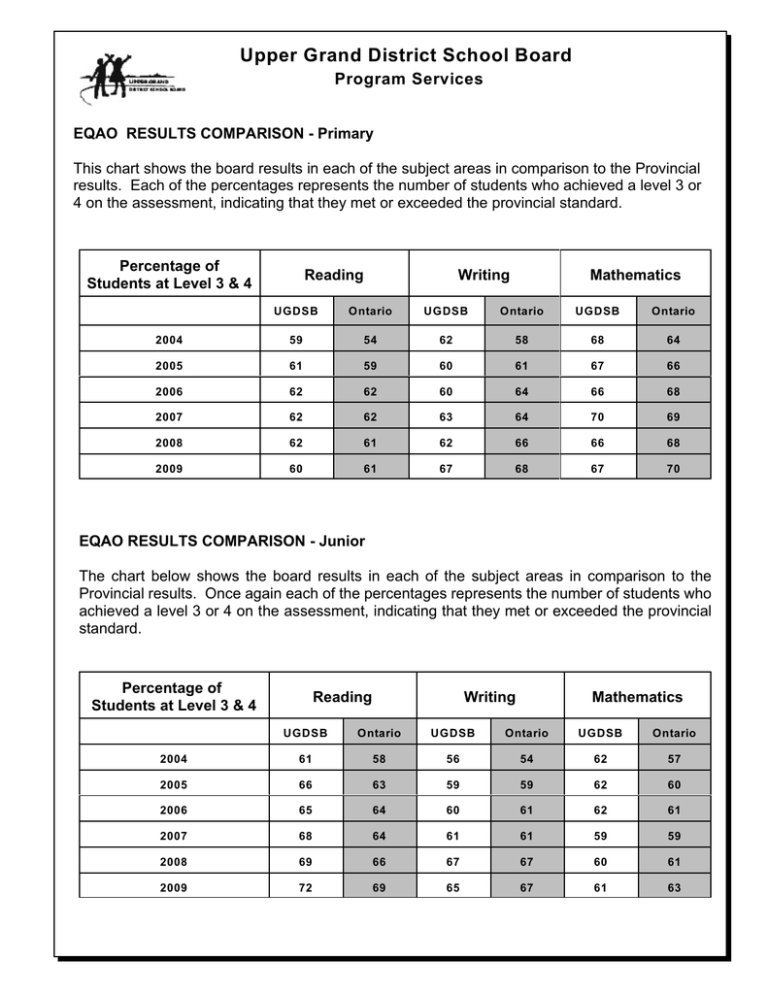
Upper Grand District School Board Program Services EQAO RESULTS COMPARISON - Primary This chart shows the board results in each of the subject areas in comparison to the Provincial results. Each of the percentages represents the number of students who achieved a level 3 or 4 on the assessment, indicating that they met or exceeded the provincial standard. Percentage of Students at Level 3 & 4 Reading Writing Mathematics UGDSB Ontario UGDSB Ontario UGDSB Ontario 2004 59 54 62 58 68 64 2005 61 59 60 61 67 66 2006 62 62 60 64 66 68 2007 62 62 63 64 70 69 2008 62 61 62 66 66 68 2009 60 61 67 68 67 70 EQAO RESULTS COMPARISON - Junior The chart below shows the board results in each of the subject areas in comparison to the Provincial results. Once again each of the percentages represents the number of students who achieved a level 3 or 4 on the assessment, indicating that they met or exceeded the provincial standard. Percentage of Students at Level 3 & 4 Reading Writing Mathematics UGDSB Ontario UGDSB Ontario UGDSB Ontario 2004 61 58 56 54 62 57 2005 66 63 59 59 62 60 2006 65 64 60 61 62 61 2007 68 64 61 61 59 59 2008 69 66 67 67 60 61 2009 72 69 65 67 61 63
