SECTION 2.1 - ORGANIZING QUALITATIVE DATA
advertisement
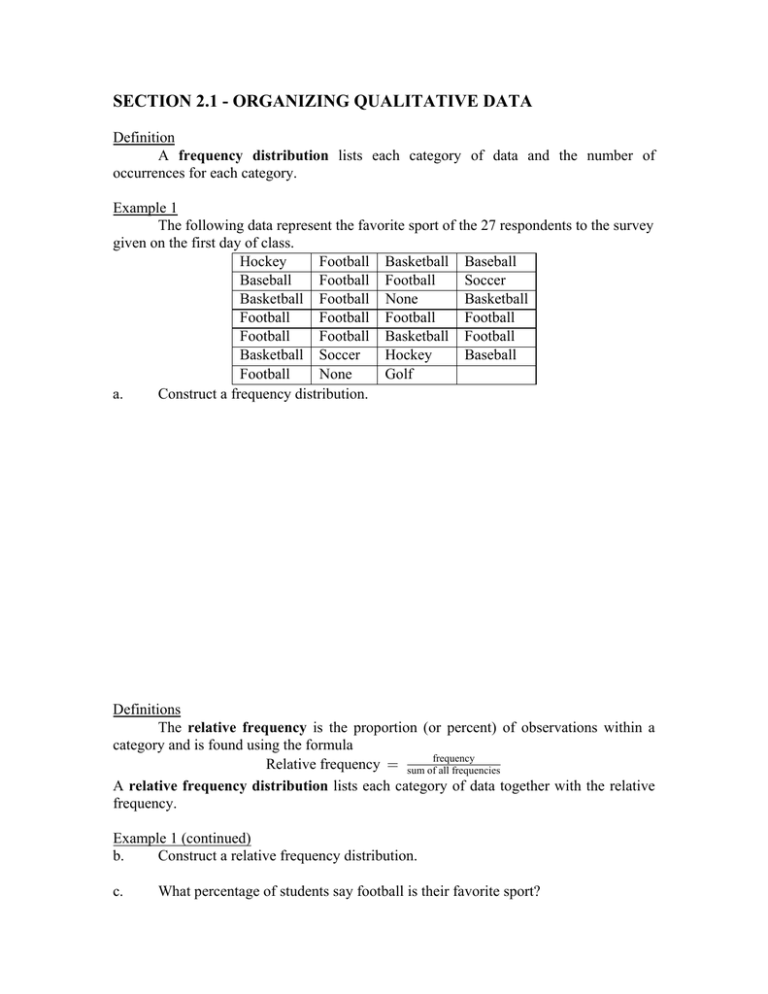
SECTION 2.1 - ORGANIZING QUALITATIVE DATA Definition A frequency distribution lists each category of data and the number of occurrences for each category. Example 1 The following data represent the favorite sport of the 27 respondents to the survey given on the first day of class. Hockey Football Basketball Baseball Baseball Football Football Soccer Basketball Football None Basketball Football Football Football Football Football Football Basketball Football Basketball Soccer Hockey Baseball Football None Golf a. Construct a frequency distribution. Definitions The relative frequency is the proportion (or percent) of observations within a category and is found using the formula Relative frequency œ sum offrequency all frequencies A relative frequency distribution lists each category of data together with the relative frequency. Example 1 (continued) b. Construct a relative frequency distribution. c. What percentage of students say football is their favorite sport? Definition A bar graph is constructed by labeling each category of data on either the horizontal or vertical axis and the frequency or relative frequency of the category on the other axis. Rectangles of equal width are drawn for each category. The height of each rectangle represents the category's frequency or relative frequency. Definition A pareto chart is a bar graph whose bars are drawn in decreasing order of frequency or relative frequency. Example 1 (continued) e. Construct a frequency bar graph. f. Construct a relative frequency bar graph. Definition A pie chart is a circle divided into sectors. Each sector represents a category of data. The area of each sector is proportional to the frequency of the category.
