Breakeven Analysis
advertisement
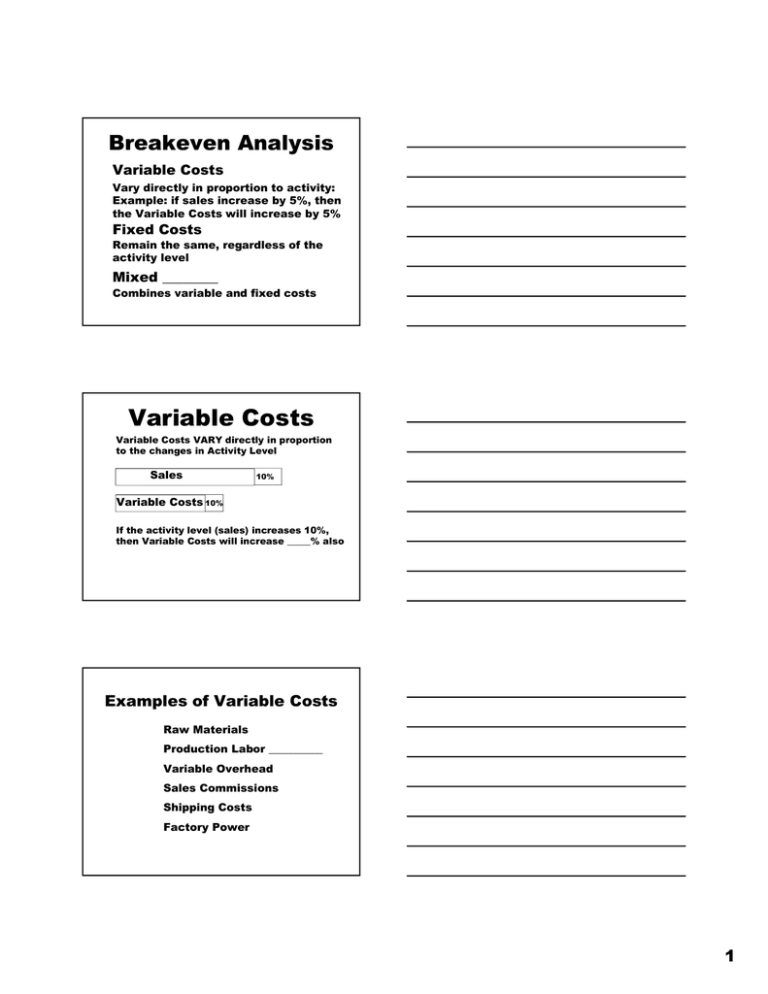
Breakeven Analysis Variable Costs Vary directly in proportion to activity: Example: if sales increase by 5%, then the Variable Costs will increase by 5% Fixed Costs Remain the same, regardless of the activity level Mixed ________ Combines variable and fixed costs Variable Costs Variable Costs VARY directly in proportion to the changes in Activity Level Sales 10% Variable Costs 10% If the activity level (sales) increases 10%, then Variable Costs will increase _____% also Examples of Variable Costs Raw Materials Production Labor __________ Variable Overhead Sales Commissions Shipping Costs Factory Power 1 Examples of Fixed Costs Depreciation Rental ____________ Building Insurance Automobile Insurance Property _________ Plant Repair GRAPH OF VARIABLE COSTS $ No activity = zero costs More activity means more costs Variable Costs Begin at the ______ (zero, zero) and draw the line to the upper right Q GRAPH OF FIXED COSTS $ Begin at Y-axis and draw horizontal _____ Fixed Costs Q Quantity in terms of units sold or produced 2 Fixed Cost + Variable Cost equals TOTAL COSTS TOTAL COST LINE $ Add the height of the Variable Cost Line to the height of Fixed Cost Line Variable Costs Fixed Costs At the Y axis, variable costs = 0 So Total Costs = Fixed Costs Q GRAPH OF TOTAL COSTS $ TOTAL COST LINE Variable Costs In other words, stack the Variable Cost Line on top of the Fixed Cost Line Q REVENUES & TOTAL COSTS $ Breakeven Point is crossing point of Revenue line and Total Cost line Breakeven Point Total Costs Revenue – Cost = 0 so Net Income is zero at Breakeven Point Q 3 Revenues < Costs = Loss $ Revenue When Quantity is less than Breakeven Total Costs Total Costs are more than (above) Revenue, so Net Income is a ______ Net Income = Revenue - Cost Q Revenues > Costs = Profit $ When Quantity is more than Breakeven Point Revenue Total Costs Then the Revenue line is above (higher) than Total Cost line, so Net Income is a ______ Q Net Income = Revenue - Cost CONTRIBUTION Unit Contribution = Price - Variable Cost per unit OR Contribution Margin = (Sales – Total Variable Costs) Sales Use the Units Contribution (top) formula when the problem is in units, but use the Contribution Margin (bottom) formula instead when the problem gives the Total Sales and Total ______________ Costs 4 BE = Fixed Cost ÷ Contribution Fixed Costs (Price – Variable Cost) Breakeven Units = OR Breakeven Sales = Fixed Costs (Sales-Variable Cost)÷Sales Use the BE Units (top) formula when the problem is in units, and the BE Sales (bottom) formula when the problem gives Total ________ and Total Variable Costs BREAKEVEN UNITS Breakeven Units = Fixed Costs (Price – Variable Cost) Example: Acme Manufacturing’s Fixed Costs are $120,000 per period, and the price per Roadrunner Trap is $25 while the Variable Cost per trap is $20 Breakeven Units = $120,000 ÷ ($25 - $20) BREAKEVEN SALES Fixed Costs Breakeven Sales = (Sales-Variable Cost)÷Sales Example: Acme Manufacturing’s Fixed Costs are $120,000 per period, while the sales are $750,000 and variable costs are $600,000 $120,000 Breakeven Sales = ($750,000-$600,000)÷$750,000 5 Comparison of BE Points Example: Acme Manufacturing’s Fixed Costs are $120,000 per period, and the price per Roadrunner Trap is $25 while the Variable Cost per trap is $20 Acme sold 30,000 traps for a total of $750,000 in sales and $600,000 in variable costs Breakeven Units = Fixed Costs (Price – Variable Cost) Breakeven Units = 24,000 Roadrunner Traps Fixed Costs Breakeven Sales = (Sales-Variable Cost)÷Sales Breakeven Sales = $600,000 24,000 traps at $25 price each equals $600,000 Net Income = Y Example: Acme Manufacturing’s Fixed Costs are $120,000 per period, and the price per Roadrunner Trap is $25 while the Variable Cost per trap is $20 Compute the Net Income if Acme sells 32,000 traps Net Income = Price*Q –Variable Cost*Q – Fixed Cost Net Income = $25*32,000 – $20*32,000 – $120,000 Y = Net Income Example: Acme Manufacturing’s Fixed Costs are $120,000 per period, and last year Acme sold 30,000 traps for a total of $750,000 in sales and $600,000 in variable costs Compute projected Y if projected sales = $800,000 Variable Cost Percentage = (VC÷Sales) last year sales AND Net Income = Sales – (VC% * Sales) – Fixed Cost Variable Cost %= $600,000 ÷ $750,000 = .800 VC% Net Income = $800,000 – (.800*$800,000) – 120,000 6 Comparison of Net ________ Example: Acme Manufacturing’s Fixed Costs are $120,000 per period, and the price per Roadrunner Trap is $25 while the Variable Cost per trap is $20; and last year Acme sold 30,000 traps for a total of $750,000 in sales and $600,000 in variable costs Compute the projected Net Income if next year Acme sells 32,000 traps for total sales of $800,000 Net Income = Price*Q –Variable Cost*Q – Fixed Cost Net Income = $800,000 – $640,000 – $120,000 Net Income = $40,000 Variable Cost Percentage = (VC÷Sales) last year sales AND Net Income = Sales – (VC% * Sales) – Fixed Cost Net Income = $800,000 – (.800*$800,000) – 120,000 Net Income = $40,000 SUMMARY of TERMS Variable Costs vary directly with the activity level Fixed Costs are assumed to stay the same Mixed Costs consist of both variable & fixed costs Total Cost = Variable Costs + Fixed Costs Breakeven Pt is where Total Cost = Total __________ SUMMARY OF FORMULAS UNITS Breakeven Units Fixed Costs (Price – Variable Cost) Total Sales&Costs Breakeven __________ Fixed Costs (Sales-Variable Cost)÷Sales Projected Income Projected Income Projected Quantity = Q Last year’s numbers PQ – VQ – Fc = Y VC% = (Variable Cost ÷ Sales) Projected Sales & FC S – (VC% * S) – Fc = Y Use Units (left) formulas when problem is in units, and Total Sales&Costs (right) formulas when the problem gives Total Sales and Total Variable Costs 7


