Short Run and Long Run Average Cost Curves: Relationship and Difference:
advertisement
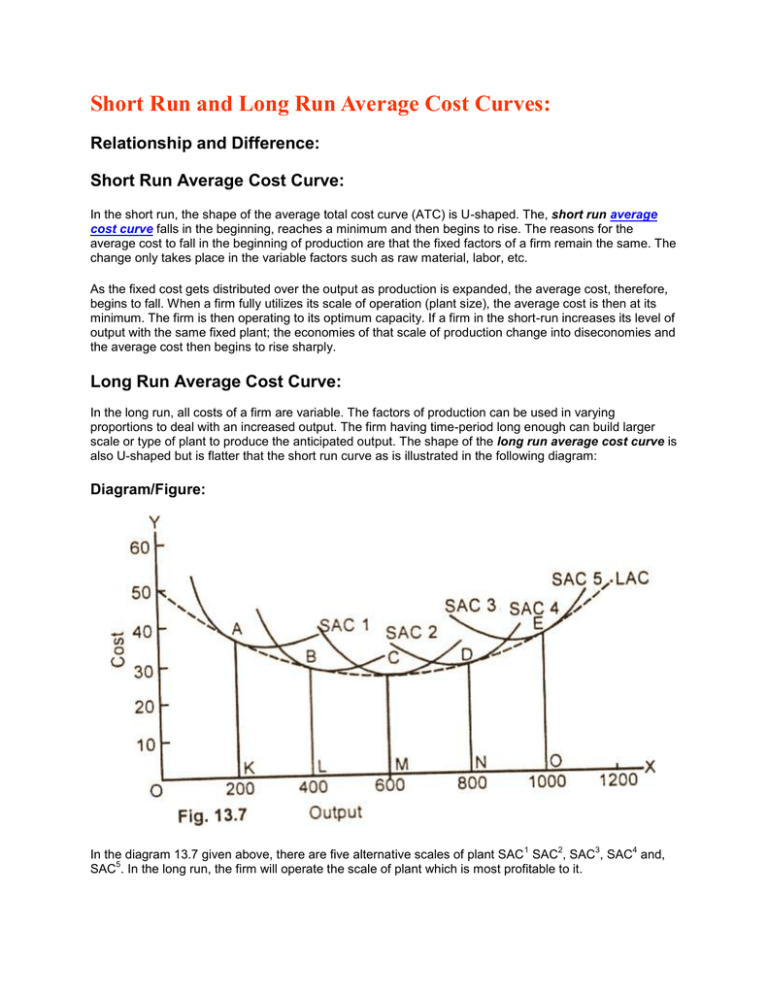
Short Run and Long Run Average Cost Curves: Relationship and Difference: Short Run Average Cost Curve: In the short run, the shape of the average total cost curve (ATC) is U-shaped. The, short run average cost curve falls in the beginning, reaches a minimum and then begins to rise. The reasons for the average cost to fall in the beginning of production are that the fixed factors of a firm remain the same. The change only takes place in the variable factors such as raw material, labor, etc. As the fixed cost gets distributed over the output as production is expanded, the average cost, therefore, begins to fall. When a firm fully utilizes its scale of operation (plant size), the average cost is then at its minimum. The firm is then operating to its optimum capacity. If a firm in the short-run increases its level of output with the same fixed plant; the economies of that scale of production change into diseconomies and the average cost then begins to rise sharply. Long Run Average Cost Curve: In the long run, all costs of a firm are variable. The factors of production can be used in varying proportions to deal with an increased output. The firm having time-period long enough can build larger scale or type of plant to produce the anticipated output. The shape of the long run average cost curve is also U-shaped but is flatter that the short run curve as is illustrated in the following diagram: Diagram/Figure: 1 2 3 4 In the diagram 13.7 given above, there are five alternative scales of plant SAC SAC , SAC , SAC and, 5 SAC . In the long run, the firm will operate the scale of plant which is most profitable to it. For example, if the anticipated rate of output is 200 units per unit of time, the firm will choose the 1 smallest plant It will build the scale of plant given by SAC and operate it at point A. This is because of the fact that at the output of 200 units, the cost per unit is lowest with the plant size 1 which is the smallest of all the four plants. In case, the volume of sales expands to 400, units, the size of the plant will be 2 increased and the desired output will be attained by the scale of plant represented by SAC at point B, If 3 the anticipated output rate is 600 units, the firm will build the size of plant given by SAC and operate it at point C where the average cost is $26 and also the lowest The optimum output of the firm is obtained at 3 point C on the medium size plant SAC . If the anticipated output rate is 1000 per unit of time the firm would build the scale of plant given by SAC and operate it at point E. If we draw a tangent to each of the short run cost curves, we get the long average cost (LAC) curve. The LAC is U-shaped but is flatter than tile short run cost curves. Mathematically expressed, the long-run average cost curve is the envelope of the SAC curves. In this figure 13.7, the long-run average cost curve of the firm is lowest at point C. CM is the minimum cost at which optimum output OM can be, obtained. . 5
