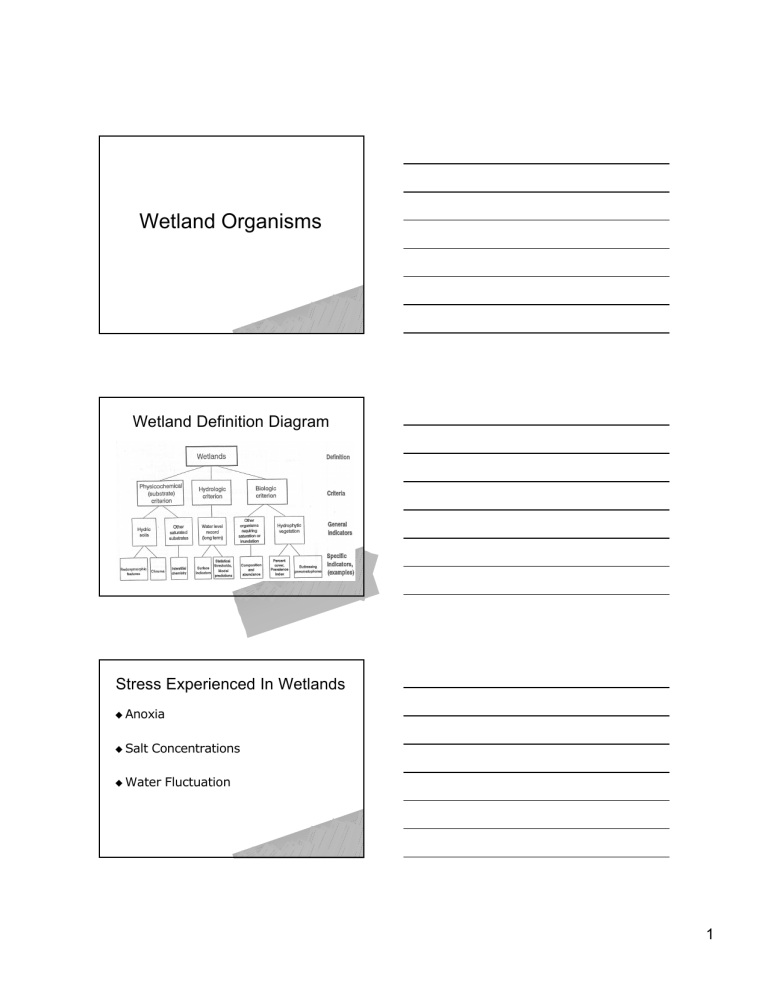
Wetland Organisms Wetland Definition Diagram Stress Experienced In Wetlands 1
advertisement

Wetland Organisms Wetland Definition Diagram Stress Experienced In Wetlands u Anoxia u Salt Concentrations u Water Fluctuation 1 Anoxic Conditions u Soils saturated/inundated u Anaerobic Conditions u May vary with season Salt Concentrations High salinity flux from tides Salinity gradient types u Intermittent (Seasonal) estuary : in Mediterranean climates, estuary forms during rainy season, dries or cut off in dry season. u Salinity varies across seasons. 2 Water Fluctuation u Tidal Systems u Non--Tidal Systems Non Protists u Anoxia (respiration) – Ability to use internal organic compounds as electron acceptors – Ability to use inorganic ions in respiration – Ability to use specific electron acceptors rather than oxygen u u sulfate Salt (osmotic & toxicity) – Complex potassium in cytoplasm – Enzymes function normally Vascular Plants u Anoxia – Structural – Nutrient absorption – Metabolic – Whole Plant Strategies u Salt – Barriers – Secretory organs u Water – Photosynthesis 3 Structural Adaptations u Aerenchyma u Adventitious Roots u Lenticels u Pneumatophores u Pressurized u Rhizosphere Gas Flow Oxygenation Aerenchyma Aerenchyma 4 Adventitious Roots Prop Roots Prop Roots 5 Lenticels Pneumatophores Pneumatophores 6 Knee Roots “Knee” Roots Root Adaptations 7 Plank Roots Pressurized Gas Flow u Air moves into internal gas spaces of aerial leaves u Forced down to roots by gradient of temperature and water vapor pressure Oxidized Rhizosphere 8 Physiological Adaptations u Nutrient Absorption u Anaerobic Respiration u Malate Production Nutrient Absorption u Normal metabolism in roots u Nitrogen – some wetland plants absorb ammonium u Iron/Manganese – oxidized rhizospheres protect u Sulfur – detoxification mechanisms Rhizosphere Oxygenation 9 Anaerobic Respiration Whole Plant Strategies u Dormancy during flooding u Seed Production in nonnon-flooded season u Buoyant Seeds u Vivipary Whole Plant Strategies 10 Vivipary Adaptations to salt - plant Some: salt gland - eliminates excess salt, maintains water balance. E.g., Spartina alterniflora Vascular marsh plants either: u Succulent : have high water concentration To reduce water loss, have: few stomata, reduced leaf area, photosynthetic stems. Rid salts by shedding leaves u Other halophytes (salt dwellers): rid salts by a) saltsalt-secreting glands; b) thin cuticles & many stomata → high transpiration Salt Adaptations u u Barrier Cells in roots Secretory Cells 11 Changes in Photosynthesis u C3 Biochemical Pathway – Phosphoglyceric Acid – Much more common u C4 Biochemical Pathway – Oxaloacetic Acid – Arid/wetter – Use CO2 More Effectively Animals u Anoxia – Specialized organs for gas exchange – Mechanism to improve oxygen gradient – Better circulation system – Decrease activity during oxygen stress – Shifts metabolic pathways u Salt – Move – Control internal osmotic concentrations Salinity adaptations - faunal u Behavioral: burrow, close up 12 Salinity adaptations - larvae Many larvae cannot osmoregulate Many estuarine inverts - pelagic larvae u E.g., Callinectes sapidus sapidus,, Eriocheir sinensis are catadromous u u Wetland Delineation Purpose – Jurisdictional – Scientific u Definition U.S. Army Corps of Engineers: inundated or saturated by surface or ground water at frequency /duration sufficient to support vegetation adapted to saturated soil conditions. u Diagnostic Characteristics – Vegetation – Soils – Hydrology Vegetation Indicator Status Categories Category Symbol Likelihood of Occurring in Wetland Obligate Wetland OBL >99% Facultative Wetland FACW >67% to 99% Facultative FAC 33% to 66% Facultative Upland FACU 1% to < 33% Obligate Upland UPL <1% 13 Wetland Soil Indicators u NRCS u Field Hydric Soil Indicators – Organic Soils – Mineral Soils uGleyed uChroma uChroma 1 with or without mottles 2 with mottles – Sulfidic Material – Sandy Soils uHigh organic content at surface uStreaked Hydrology Indicators u Recorded Data – U.S. Corps of Engineers – USGS – State / Local Agencies u Field Data – Soil Saturation – Watermarks – Drift Lines – Sediment Deposits Delineation Method u Preliminary Data – – – – – – – – u USGS Quadranlge Maps NWI Maps Soil Survey Stream Gage EISs State Wetland Determinations Local Wetland Inventories Aerial Photographs I nn-Field Data (transects) – Visual Changes – Chose Representative Points – Characterize Each Change u u u Vegetation Soils Hydrology 14


