Document 10283989
advertisement
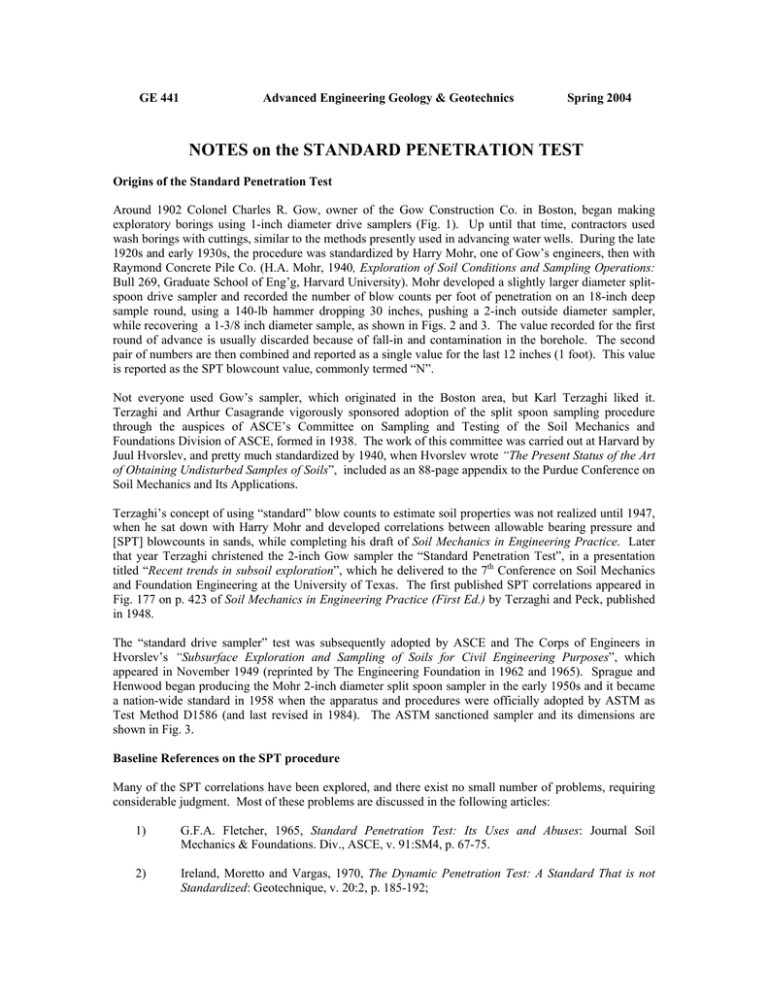
GE 441 Advanced Engineering Geology & Geotechnics Spring 2004 NOTES on the STANDARD PENETRATION TEST Origins of the Standard Penetration Test Around 1902 Colonel Charles R. Gow, owner of the Gow Construction Co. in Boston, began making exploratory borings using 1-inch diameter drive samplers (Fig. 1). Up until that time, contractors used wash borings with cuttings, similar to the methods presently used in advancing water wells. During the late 1920s and early 1930s, the procedure was standardized by Harry Mohr, one of Gow’s engineers, then with Raymond Concrete Pile Co. (H.A. Mohr, 1940, Exploration of Soil Conditions and Sampling Operations: Bull 269, Graduate School of Eng’g, Harvard University). Mohr developed a slightly larger diameter splitspoon drive sampler and recorded the number of blow counts per foot of penetration on an 18-inch deep sample round, using a 140-lb hammer dropping 30 inches, pushing a 2-inch outside diameter sampler, while recovering a 1-3/8 inch diameter sample, as shown in Figs. 2 and 3. The value recorded for the first round of advance is usually discarded because of fall-in and contamination in the borehole. The second pair of numbers are then combined and reported as a single value for the last 12 inches (1 foot). This value is reported as the SPT blowcount value, commonly termed “N”. Not everyone used Gow’s sampler, which originated in the Boston area, but Karl Terzaghi liked it. Terzaghi and Arthur Casagrande vigorously sponsored adoption of the split spoon sampling procedure through the auspices of ASCE’s Committee on Sampling and Testing of the Soil Mechanics and Foundations Division of ASCE, formed in 1938. The work of this committee was carried out at Harvard by Juul Hvorslev, and pretty much standardized by 1940, when Hvorslev wrote “The Present Status of the Art of Obtaining Undisturbed Samples of Soils”, included as an 88-page appendix to the Purdue Conference on Soil Mechanics and Its Applications. Terzaghi’s concept of using “standard” blow counts to estimate soil properties was not realized until 1947, when he sat down with Harry Mohr and developed correlations between allowable bearing pressure and [SPT] blowcounts in sands, while completing his draft of Soil Mechanics in Engineering Practice. Later that year Terzaghi christened the 2-inch Gow sampler the “Standard Penetration Test”, in a presentation titled “Recent trends in subsoil exploration”, which he delivered to the 7th Conference on Soil Mechanics and Foundation Engineering at the University of Texas. The first published SPT correlations appeared in Fig. 177 on p. 423 of Soil Mechanics in Engineering Practice (First Ed.) by Terzaghi and Peck, published in 1948. The “standard drive sampler” test was subsequently adopted by ASCE and The Corps of Engineers in Hvorslev’s “Subsurface Exploration and Sampling of Soils for Civil Engineering Purposes”, which appeared in November 1949 (reprinted by The Engineering Foundation in 1962 and 1965). Sprague and Henwood began producing the Mohr 2-inch diameter split spoon sampler in the early 1950s and it became a nation-wide standard in 1958 when the apparatus and procedures were officially adopted by ASTM as Test Method D1586 (and last revised in 1984). The ASTM sanctioned sampler and its dimensions are shown in Fig. 3. Baseline References on the SPT procedure Many of the SPT correlations have been explored, and there exist no small number of problems, requiring considerable judgment. Most of these problems are discussed in the following articles: 1) G.F.A. Fletcher, 1965, Standard Penetration Test: Its Uses and Abuses: Journal Soil Mechanics & Foundations. Div., ASCE, v. 91:SM4, p. 67-75. 2) Ireland, Moretto and Vargas, 1970, The Dynamic Penetration Test: A Standard That is not Standardized: Geotechnique, v. 20:2, p. 185-192; Figure 1 (above left) – The original Gow Pipe Sampler utilized 1-inch diameter drill rod and 1-inch diameter pipe with a beveled cutting tip. It was introduced around 1902. Figure 2 (above right) – Components of SPT spilt spoon sampler, as developed by Harry Mohr in the early 1930s, after Gow Construction had been absorbed by the Raymond Concrete Pile Company. Figure 3 – Standard dimensions for the SPT sampler, as given in ASTM D1586. 3) V.F.B. de Mello, 1971, The Standard Penetration Test: Proceedings of the 4th Panamerican Conference on Soil Mechanics and Foundation Engineering: San Juan, PR, v.1:1-86; and 4) Yves Lacroix and Harry Horn, 1973, Direct Determination and Indirect Evaluation of Relative Density and Its Use on Earthwork Construction Projects: in Evaluation of Relative Density and Its Role in Geotechnical Projects Involving Cohesionless Soils: ASTM Special Technical Publication 523, p. 251-280. In 1986 a series of new correlations and corrections were introduced, which are in current usage. These include: 5) C.O. Riggs, 1986, North American Standard Penetration Test practice: An essay: in Use of Insitu Tests in Geotechnical Engineering, ASCE Geotechnical Special Publication No. 6; 6) A.W. Skempton, 1986, Standard Penetration Test Procedures and the Effects in Sands of Overburden Pressure, Relative Density, Particle Size, Aging and Overconsolidation: Geotechnique, v. 36:3, p. 425-447; and 7) S.S.C. Liao and R.V. Whitman, 1986, Overburden Correction Factors for SPT in Sand: Journal of Geotechnical Engineering, A.S.C.E., v. 112:3, p. 373-377. In 1990, Clayton presented an expanded listing of SPT hammer efficiencies (Em) in: 8) C.R.I. Clayton, 1990, SPT Energy Transmission: Theory, Measurement, and Significance: Ground Engineering, v. 23:10, p. 35-43. For evaluation of liquefaction potential, raw SPT blowcounts must be corrected to (N1)60 values, as described in the following sections. Burmister’s (1948) input energy correction Despite all the encouragement to adopt Terzaghi’s SPT test, most people went on using whatever devices they had previously, until more and more of Casagrande’s students infiltrated the ranks of foundation engineering. In the New York area the favored device was the 3.625-inch diameter Moran & Proctor, or M & P Sampler, which had been developed by Carlton Proctor for the firm’s exploration of the San Francisco Bay Bridge project (C. S. Proctor, 1936, The Foundations of the San Francisco-Oakland Bay Bridge: Proceedings of the Int’l Conference on Soil Mechanics and Foundation Engineering, Harvard Univ., v.3, p. 183-193). The M & P sampler allowed recovery of a much larger 3-inch diameter samples, using 5000 in-lbs. per blow in lieu of the SPT’s 4,200 in-lbs. The M & P sampler is shown in Fig. 4. Moran & Proctor engaged Professor Don Burmister of Columbia University to develop a scheme for correlating M & P sampler blow counts with those of Mohr’s SPT sampler, commonly employed in New England and elsewhere (after 1948). Burmister assumed that SPT blowcounts relate energy input versus the area of the sampler barrel and sample. He reasoned that simple correlations could be made between the various size samplers by ignoring the increase in skin friction area that accompanies larger diameter samplers and increasing skin friction with depth. Despite the simplistic physics, these rough correlations have proven valuable in practice. Burmister suggested a simple input energy correction for the ratio of driving weight (hammer energy) versus sample diameter, published as: D.M. Burmister, 1948, The importance and practical use of relative density in soil mechanics: Proceedings of ASTM, v. 48:1249. Burmister’s relationship only considered energy input (weight of hammer multiplied by drop height), size of the recovered sample (Di) and sample barrel diameter (Do). This could be rewritten to provide input energy and diameter correction for other tests to correlate with the SPT (ASTM D-1586): - (1.375 in)2 ] N* = NR (W lbs) (H in) [ (2.0 in)2 2 2 (140 lb) (30 in) ( Do ) - (Di ) Where W is the hammer weight, H is the height of the drop, Do is the outside diameter of the sample barrel, Di is the diameter of the drive sample, NR is the raw blow count, and N* is the blowcount reported as the equivalent SPT value. The Burmister energy correction takes the raw “SPT” blow count value and multiplies it by an appropriate fraction, derived from the relationship above. The corrected blowcount value is usually denoted by an asterisk (*) on the boring log, with a note explaining that the blow counts have been adjusted. If we apply Burmister’s simple equation to the Modified California sample barrel, with an outside diameter of 3.0 inches and a sample diameter of 2.4 inches, the calculated correction would be 0.65. This means the equivalent SPT N values would be about 65% of those recorded with the Modified California apparatus. Most workers cite Burmister’s 1948 “correction” for adjusted blow counts recorded with larger diameter drive samplers, or for lower energy hammers (such as the 70-lb hammer used with Mobile Drilling’s Minuteman portable drilling rig). Figure 4 – The M & P drive sampler was developed by Carlton Proctor of Moran & Proctor in the early 1930s. It was the preferred drive sampler in the New York City area because it recovers a less disturbed sample than the smaller diameter SPT. Lacroix and Horn (1973) correction In 1973 Yves Lacroix and Harry Horn of Woodward-Clyde wrote an article titled “Direct Determination and Indirect Evaluation of Relative Density and Its Use on Earthwork Construction Projects”, published in Evaluation of Relative Density and Its Role in Geotechnical Projects Involving Cohesionless Soils: ASTM Special Technical Publication 523, p. 251-280. This ASTM conference had been held in Los Angeles in June 1972, and the correction proposed by Lacroix and Horn was subsequently adopted by many geotechnical practioners when working close to geologic contacts with stiffer materials. Lacroix and Horn (1973) proposed that nonstandard penetration resistance, N1, could be correlated with Standard Penetration Resistance, N, for drive samples or a solid conical point, such as a static cone, which incorporated consideration of driving energy and distance of penetration. They reasoned that the energy required to drive the sampler or cone a given distance or “depth” (L) was directly proportional to the square of the outside diameter (D) and the distance of penetration, and inversely proportional to the energy per blow (Weight of hammer multiplied by the height of drop, WH): N = N1 (2 in/D1)2 x 12 in/L1 x W1 /140 lb x H1 /30 in = 2 N1W1H1 175 D2 L1 When this correction is applied to the Modified California sampler (Do = 3.0 in., and Di = 2.4 in), the predicted correction is reduced, to 0.44 N1, where N1 is the raw blowcount recorded during driving of the larger diameter Modified California sampler. The depth of penetration (L1) in the denominator is the distance the sampler was advanced during the sample round. In most instances, this is given as the last 12 inches in a 18 inch sampling round (so, L1 = 12 inches). The Lacroix and Horn correction gives a more conservative estimate of the SPT blowcounts than that derived by Burmister’s (1948) energy correlation (discussed previously). The LaCroix and Horn correction appears most valid when sampling is undertaken within 5 to 8 sample barrel diameters (15” to 24”) of a geologic contact with a stiffer horizon (such silty or clayey materials above cemented sands or gravels). The stiffness of the base layer causes the blow counts to become elevated because the tip of the sampler senses the ground beneath its cutting tip. Side-by-Side Correlations Between 1991-95 the author performed a series of side-by-side sampling tests using the SPT and Modified California samplers in Tertiary-age sedimentary materials along the California coast to evaluate what manner of correction seemed most appropriate under general conditions of use. This study revealed that the best fit correction is close to: SPT N = 0.50 to 0.67 NR , where NR is the raw recorded blowcount on the larger sampler (the average correction was about 0.56). The Lacroix and Horn correction would appear most applicable to those situations where the sampler is being driven through relatively low stiffness materials in close proximity to a much stiffer horizons (like cemented sands or gravels) within 5 to 8 barrel diameters (15” to 24”) beneath the sampler tip. Standardized SPT corrections SPT data can be corrected for a number of site specific factors to improve its repeatability. Burmister’s 1948 energy correction assumed that the hammer percussion system was 100% efficient (a 140-lb hammer dropping 30 inches = 4,200 ft-lbs raw input energy). In A.W. Skempton, 1986, Standard Penetration Test procedures and the Effects in Sands of Overburden Pressure, Relative Density, Particle Size, Aging and Overconsolidation: Geotechnique, v. 36:3, p. 425-447, the procedures for determining a standardized blowcount were presented, which allow for hammers of varying efficiency to be accounted for. This corrected blowcount is referred to as “N60 “, because the original SPT (Mohr) hammer has about 60% efficiency, and this is the “standard” to which other blowcount values are compared. N60 is given as: N60 = Em CB CS CR N 0.60 where N60 is the SPT N-value corrected for field procedures and apparatus; Em is the hammer efficiency; CB is the borehole diameter correction; CS is the sample barrel correction; CR is the rod length correction; and N is the raw SPT N-value recorded in the field. Skempton (1986) provides charts for estimating the appropriate values of CB, CS and CR. Clayton provides an expanded listing of SPT hammer efficiencies (Em) in C.R.I. Clayton, 1990, SPT Energy Transmission: Theory, Measurement, and Significance: Ground Engineering, v. 23:10, p. 35-43. In sands the Standard Penetration resistance, N, has been found to be influenced by the effective overburden pressure. Gibbs and Holtz (1957) presented method for determination of SPT N values corrected for a “standard effective overburden” pressure, N’, so that various resistance values could be compared. N’ was defined as N’ = CN NF; where NF is the unfactored SPT blowcount value, taken in the ground; and CN is a correction factor. The standard effective overburden pressure was given as an effective stress, σ’ , (overburden confinement). The correction factor CN is taken as the reciprocal of the square root of σ’. The Gibbs and Holtz overburden correction was found lacking when applied to situations where samples were taken from near the bottom of uniform soil deposits, which exhibit higher blowcounts, because the sampler senses the stiffer material lying below. In 1986, Liao and Whitman presented the currently held overburden correction, termed (N1)60 (S.S.C. Liao and R.V. Whitman, 1986, Overburden Correction Factors for SPT in Sand: Journal of Geotechnical Engineering, A.S.C.E., v. 112:3, p. 373-377). The (N1)60 blowcount is given as: (N1)60 = N60 √ 2000 psf σ z‘ where σz‘ is vertical effective stress where the sample was recovered. Over the past decade, published correlations usually relate corrected Standard Penetration Test resistance (N1)60 with other parameters, such as relative density and angle of internal friction. These are also useful in assessments of liquefaction potential. Drive sample disturbance Thin wall samplers are defined as those with a wall thickness less than 2-1/2% of the diameter, such as Shelby Tubes. Drive samples less than 6.35 cm (2.5 inches) in diameter should be regarded as “disturbed” and their reported moisture and bulk density values judged accordingly. 6.35 cm (2.5 in) drive samples can also be disturbed, especially when taken in the rooted zone of natural slopes, commonly in the upper 2 meters (6.56 ft). This is because the rooted zone is typically of lower density, due to root action and creep (Burmister, 1948, op cit.). When advancing drive samples within the upper 2 m of a native slope, it is advisable to mark the Kelly bar with crayon and compare the distance advanced during the sample round with the actual thickness of the recovered soil taken from the sample barrel sleeves. A careful comparison usually shows that the sample has been densified during the sampling process, often leading to erroneous conclusions about soil strength in these upper zones. Sample disturbance has also been described by the Area Ratio, originally described by Mohr in 1936 (Harry M. Mohr, 1936, Exploration of Soil Conditions and Sampling Operations: International Conference of Soil Mechanics and Foundation Engineering, Harvard Univ., v. 3:24 and a short while later by Hvorslev (H.J. Hvorslev, 1940, The Present Status of the Art of Obtaining Undisturbed Samples of Soils: Harvard Univ. Soil Mechanics Series 14). It was eventually standardized in M. J. Hvorslev (1949, op cit). The Area Ratio is given as: Ar (%) = (Do)2- (Di)2 x 100 (Di)2 Shelby Tube Sampler A drive sample can be considered undisturbed if the area ratio is less than or equal to 10%. In 1936 Harry Mohr developed the “Shelby Tubing” or “Thin-Wall Sampler” in response to a request made by Prof. Arthur Casagrande at Harvard. Casagrande wanted a less disturbed sample within the standard 2-1/2-inch casing size then employed in most exploratory borings around Boston. The term “Shelby Tubing” was a trade name for hard-drawn, seamless steel tubing, manufactured by the National Tube Company of Lorain, Ohio, which is available nation-wide (National Tubing was owned by US Steel). Shelby Tubes have an inside diameter of 2.0 inches and use 16 gage (0.0578 inches) to 18 gage (0.0451 inches) wall thickness tubes advancing a 36-inch section of tubing ahead of the sampler, recovering a 33-inch long sample (see Fig. 5). The area ratio for a SPT test is 110%, while that for a thin-wall Shelby Tube is about 13.7%. Despite this, soft soils recovered in Shelby Tubes are generally assumed to be more-or-less undisturbed, while all splitspoon samplers should be regarded as disturbed samples. The dimensions of a typical Shelby Tube sampler are shown in Figure 5. Some caution should been advised in performing strength and compressibility tests, such as consolidated triaxial compression, and unconfined compression. The impact of drive sampling disturbance on laboratory indices was recognized early on, and summarized by Phil Rutledge in his early research with Arthur Casagrande at Harvard (P.C. Rutledge, 1944, Relation of Undisturbed Sampling to Laboratory Testing: Transactions ASCE, v. 109, p. 1155-1183). Soil behavior in lab test is greatly influenced by sampling disturbance, as illustrated in Figure 6. Nevertheless, disturbed samples may be adequate for indices tests, such as Atterberg Limits and grain size distribution necessary for proper classification of the soil type. A great many piston and drive samplers of larger than 4-inches diameter were developed by various workers beginning in the late 1930s, in the attempt to recover less disturbed samples of compressible materials, such as the Boston Blue Clay. These alternative samplers are summarized in: M. Juul Hvorslev, 1949, Subsurface Exploration and Sampling of Soils for Civil Engineering Purposes: USACOE Waterways Experiment Station, Vicksburg [reprinted by the Engineering Foundation in 1962 and 1965], 521 p. Figure 5 – Original concept for Shelby Tube thin-wall piston sampler, as developed by Harry Mohr in 1936.
