First Law of Thermodynamics Two closed thermodynamic cycles
advertisement
First Law of Thermodynamics
Two closed thermodynamic cycles
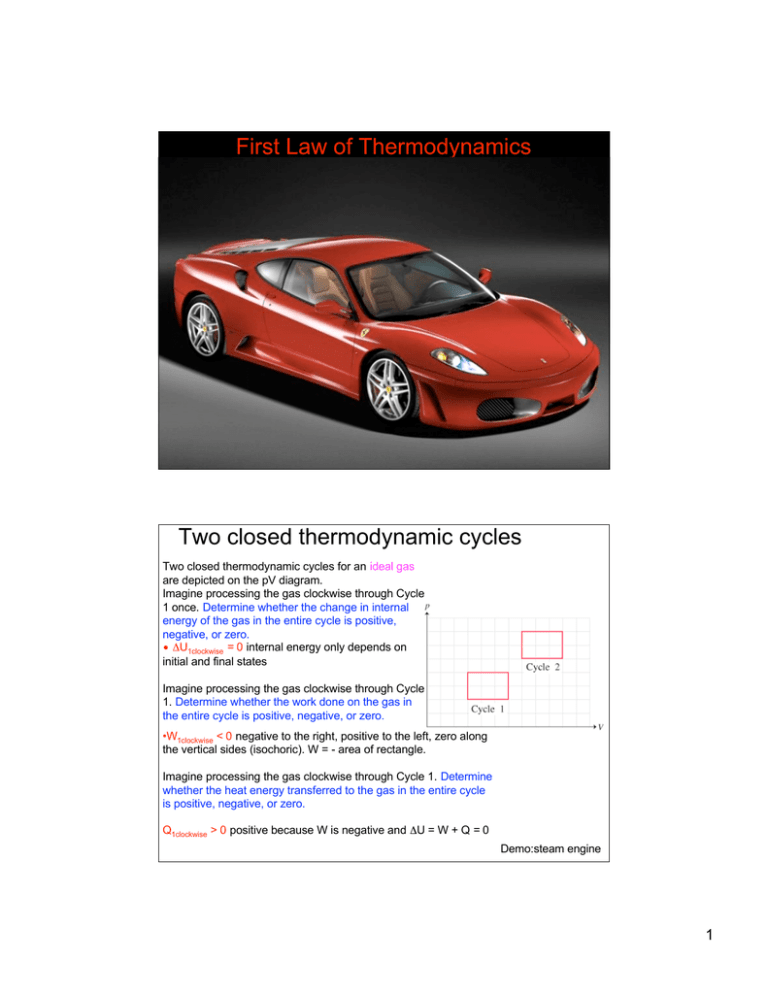
Two closed thermodynamic cycles for an ideal gas
are depicted on the pV diagram.
Imagine processing the gas clockwise through Cycle
1 once. Determine whether the change in internal
energy of the gas in the entire cycle is positive,
negative, or zero.
• ΔU1clockwise = 0 internal energy only depends on
initial and final states
Imagine processing the gas clockwise through Cycle
1. Determine whether the work done on the gas in
the entire cycle is positive, negative, or zero.
•W1clockwise < 0 negative to the right, positive to the left, zero along
the vertical sides (isochoric). W = - area of rectangle.
Imagine processing the gas clockwise through Cycle 1. Determine
whether the heat energy transferred to the gas in the entire cycle
is positive, negative, or zero.
Q1clockwise > 0 positive because W is negative and ΔU = W + Q = 0
Demo:steam engine
1
A triangular thermodynamic cycle
A cylinder with initial volume V contains a
sample of gas at pressure p. The gas is
heated in such a way that its pressure is
directly proportional to its volume. After the
gas reaches the volume 3V and pressure 3p,
it is cooled isobarically to its original volume
V. The gas is then cooled isochorically until it
returns to the original volume and pressure.
Find the work W done on the gas during the
entire process
It is reasonable to use the ideal-gas model
in this problem if :
2. The temperature is well above the
condensation point.
3. The density of the gas is low.
The processes involved can be assumed to
be quasi-static if: 1. They happen slowly.
The work done on the gas during:
its expansion from V → 3V is: negative
the isobaric process is: positive
the isochoric process is: zero
A triangular thermodynamic cycle
A cylinder with initial volume V contains a
sample of gas at pressure p. The gas is
heated in such a way that its pressure is
directly proportional to its volume. After the
gas reaches the volume 3V and pressure 3p,
it is cooled isobarically to its original volume
V. The gas is then cooled isochorically until it
returns to the original volume and pressure.
Find the work W done on the gas during the
entire process
Let us now calculate the total work done
on the goes during the cycle
W1 = -(2pV+2p2V/2) = -2pV-2pV = -4pV
W2 = 2V3p = 6pV
W3 = 0
W = W1+ W2+ W3= 2 pV
2 pV = area of the triangle in magenta
If the direction of the process was reversed, the overall work would be negative:
W = - area = - 2 pV
2
A triangular thermodynamic cycle
If the gas cycle was reordered, so that
the isochoric process came before the
isobaric process, as in the bottom
diagram shaded in blue, the work done
on the gas during the entire new cycle
would be:
1. positive
2. negative
3. zero
Demo: IR parabolic mirrors
Compression of a Jaguar XK8 cylinder
A Jaguar XK8 convertible has an eight-cylinder engine. At the beginning of its
compression stroke, one of the cylinders contains 499 cm3 of air at atmospheric
pressure 1.01 x 10⁵ Pa and a temperature of 27.0°C.
At the end of the stroke, the air has been compressed to a volume of 46.2 cm3 and the
gauge pressure has increased to 2.72 x 10⁶ Pa.
What is the final temperature of the gas in an engine cylinder after the compression
stroke?
T2 = 510°C
The increase in gas
temperature caused by
this compression stroke is
one of the reasons why a
car engine gets so hot
when it is running.
Demo: freezing by evaporation
3
specific heat, latent heat, and temperature versus time graphs
The graph shows how the temperature of an initially solid sample changes as time goes
by when it is placed above a flame that delivers a constant heating power (that is, a fixed
amount of energy input in the form of heat per second). The process occurs in five
distinct steps:
1. Increase the temperature of the solid until it reaches its melting temperature.
2. Melt the solid to form a liquid, maintaining a constant temperature.
3. Increase the temperature of the liquid until it reaches its boiling temperature.
4. Boil away all the liquid to form a gas, maintaining a constant temperature.
5. Increase the temperature of the gas (assuming that the gaseous sample is confined).
Use the graph to rank the sizes of
the following:
A. specific heat of the solid, cS
B. specific heat of the liquid, cL
C. specific heat of the gas, cG
The smaller the specific heat,
the more quickly the
temperature can change, so the
steeper the slope on a
temperature versus time graph.
Thus: cL>cS>cG
specific heat, latent heat, and temperature versus time graphs
The graph shows how the temperature of an initially solid sample changes as time goes
by when it is placed above a flame that delivers a constant heating power (that is, a fixed
amount of energy input in the form of heat per second). The process occurs in five
distinct steps:
1. Increase the temperature of the solid until it reaches its melting temperature.
2. Melt the solid to form a liquid, maintaining a constant temperature.
3. Increase the temperature of the liquid until it reaches its boiling temperature.
4. Boil away all the liquid to form a gas, maintaining a constant temperature.
5. Increase the temperature of the gas (assuming that the gaseous sample is confined).
Use the graph to rank the sizes of
the following:
1. latent heat of fusion, LF
2. latent heat of vaporization, LV
The two latent heats are related to
the (horizontal) durations of
sections 2 and 4 on the graph. You
can rank the latent heats by
estimating which phase change
takes longer to accomplish.
L = 2256 J/g
Thus: LF = LV water V
LF = 334 J/g
{
4

