BIOL 283 Lab 7: Hypothesis tests

BIOL 283 Lab 7: Hypothesis tests
3a
3b
4a
4b
5a
Lab Objectives: 1.
Learn when to use a particular hypothesis test
2.
Learn how to do all possible hypothesis tests learned thus far
3.
Practice practical problems involving hypotheses
4.
Become a user of inferential statistical methods rather than a just a student in statistics
5.
Get a feel for the R language
6.
Develop a resourceful attitude
Goal: This lab will be quite different than those before. It is assumed that you have developed sufficient skills in R. You will be given a list of R commands for performing “canned” hypothesis tests. You will be given a dichotomous key for helping to discern when to use each test. You will be given some example problems without a blueprint for how to do them. You will struggle to figure out how to do them, learning how to apply particular hypothesis tests, in the process.
This lab should help you become a user of inferential statistical methods, such that a novel problem (like given on an exam) will seem like a surmountable challenge rather than a confusing conundrum.
Part I. Dichotomous key.
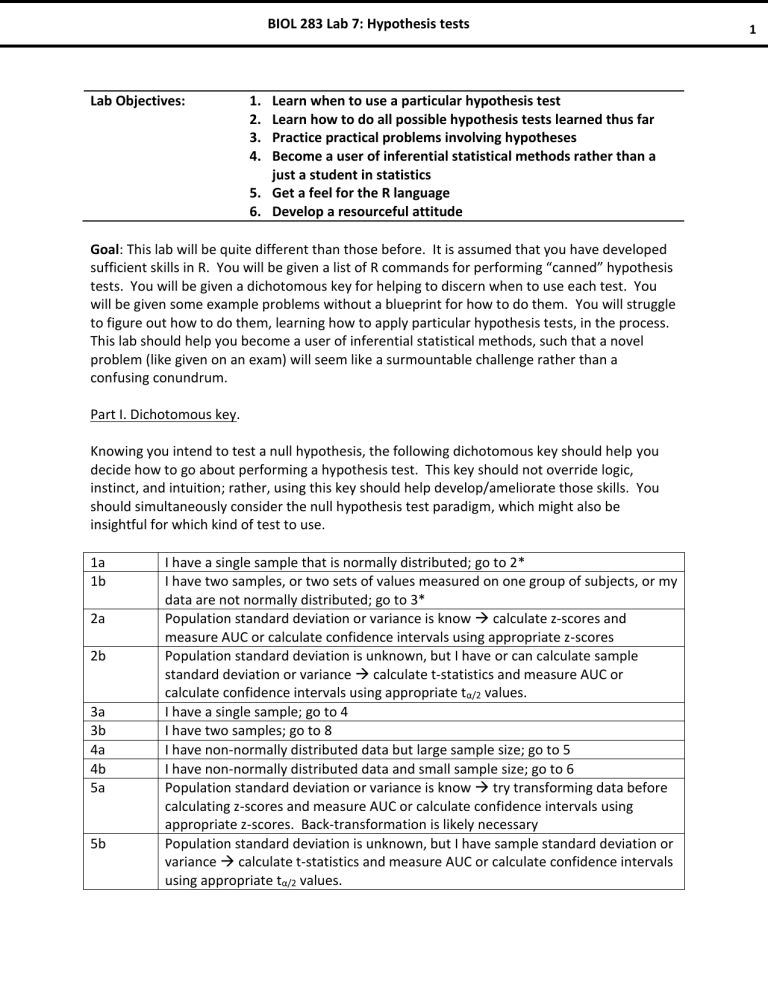
Knowing you intend to test a null hypothesis, the following dichotomous key should help you decide how to go about performing a hypothesis test. This key should not override logic, instinct, and intuition; rather, using this key should help develop/ameliorate those skills. You should simultaneously consider the null hypothesis test paradigm, which might also be insightful for which kind of test to use.
1a
1b
2a
2b
I have a single sample that is normally distributed; go to 2*
I have two samples, or two sets of values measured on one group of subjects, or my data are not normally distributed; go to 3*
Population standard deviation or variance is know calculate z-scores and measure AUC or calculate confidence intervals using appropriate z-scores
Population standard deviation is unknown, but I have or can calculate sample standard deviation or variance calculate t-statistics and measure AUC or calculate confidence intervals using appropriate t
α/2
values.
I have a single sample; go to 4
I have two samples; go to 8
I have non-normally distributed data but large sample size; go to 5
5b
I have non-normally distributed data and small sample size; go to 6
Population standard deviation or variance is know try transforming data before calculating z-scores and measure AUC or calculate confidence intervals using appropriate z-scores. Back-transformation is likely necessary
Population standard deviation is unknown, but I have sample standard deviation or variance calculate t-statistics and measure AUC or calculate confidence intervals using appropriate t
α/2
values.
1
BIOL 283 Lab 7: Hypothesis tests
6a
6b
7a
7b
8a
A transformation of my data has made them normally distributed; go to 7
A transformation of my data has failed to make them normally distributed it is probably time to consider that finding the mean of the sample for the purpose of a hypothesis test is foolhardy. Perhaps the shape of the distribution is more interesting.
Population standard deviation or variance (of transformed data) is known calculate z-scores and measure AUC or calculate confidence intervals using appropriate z-scores
Population standard deviation (of transformed data) is unknown, but I can calculate sample standard deviation calculate t-statistics and measure AUC or calculate confidence intervals using appropriate t
α/2
values.
My samples are not independent; probably represent two sets of values from the same subjects, as in a paired design; go to 9
8b
9a
9b
10 a
10 b
11a
11b
My samples are independent; go to 11
The pairwise differences (or transformations of the differences) are normally distributed use paired t-test or confidence interval for mean difference
The pairwise differences are not normally distributed, or I am more interested in the ranks of values; go to 10
I am only interested in the sign of the difference Sign Test
I am interested in both the magnitude of ranked differences, and the sign of differences Wilcoxon signed Rank Test
Both samples have normally distributed data (or normally distributed transformations of the data) two-sample t-test
At least one sample has non-normally distributed data, or only ranks are important
Wilcoxon-Mann-Whitney Test
12c I don’t care about these silly assumptions and conditions; I want to do a randomization test!
* Be aware that if you are given a problem that gives you sample means and standard deviations, but not the data, there is probably an implicit assumption that the data are normally distributed or have large sample sizes (but it should be explicitly stated, if that is the case). In this case, follow the appropriate path through the key, assuming normality.
Part II. R commands.
The following list of R commands should help perform tests in short time. Do not rely on results if you do not understand how they were generated. You should be able to do any part of these tests by hand. However, using R will allow you to move faster from one problem to the next.
(When one develops a good understanding of inferential methods, one can become a user of inferential methods, and rely on computer programs like R to do the heavy lifting for data analyses. This is also a good way to guard against computational mistakes.)
2
BIOL 283 Lab 7: Hypothesis tests
For a single value, y, or a variable, Y,
Method
Normal Probability plot z-score (known μ and σ) for a single value z-score (known μ and σ) for sample mean
Single sample t-test (can change mu to another value, if not 0)
Two-sample t-test (mu is difference in means; can change mu to another value, if not meant to be 0)
Paired t-test
Two ways to get the same answer, assuming Y1 and Y2 are values measured on the same subjects
Wilcoxon Mann Whitney
Two-sample test
Wilcoxon Signed Rank Test, for paired designs
Sign Test (a.k.a. Binomial Test)
Confidence intervals
R function or commands qqnorm(Y) z = scale(y, center = mu, scale = sigma) pnorm(z,0,1) z = scale(mean(Y), center = mu, scale = sigma/sqrt(n)) pnorm(z,0,1) t.test(Y, mu = 0, alternative = “t”, conf.level = 0.95)
# two-sided t.test(Y, mu = 0, alternative = “g” , conf.level = 0.95)
# greater than t.test(Y, mu = 0, alternative = “l” , conf.level = 0.95)
# less than t.test(Y1, Y2, mu = 0, alternative = “t” , conf.level = 0.95)
# two-sided t.test(Y1, Y2, mu = 0, alternative = “g” , conf.level = 0.95)
# greater than t.test(Y1, Y2, mu = 0, alternative = “l” , conf.level = 0.95)
# less than t.test((Y1-Y2), mu = 0, alternative = “t” , conf.level = 0.95)
# two-sided t.test(Y1, Y2, mu = 0, alternative = “t”, paired=T, conf.level =
0.95) # two-sided
# other alternative hypotheses done analogously wilcox.test(Y1, Y2, mu = 0, alternative = “t”, conf.level = 0.95) # two-sided wilcox.test(Y1, Y2, mu = 0, alternative = “g” , conf.level = 0.95) # greater than wilcox.test(Y1, Y2, mu = 0, alternative = “l” , conf.level = 0.95) # less than wilcox.test(Y1, Y2, mu = 0, alternative = “t”, paired =T, conf.level
= 0.95)
# two-sided wilcox.test(Y1, Y2, mu = 0, alternative = “g” , paired =T, conf.level
= 0.95)
# greater than wilcox.test(Y1, Y2, mu = 0, alternative = “l” , paired =T, conf.level
= 0.95)
# less than binom.test(c(n-positives, n-negatives), p = 0.5)
Done with any of the “tests” above. For wilcox.test, one must add conf.int=T, as a function parameter change.
3
BIOL 283 Lab 7: Hypothesis tests
Assuming that data were not given, but means, sample sizes, and standard deviations were given, such that either t- or z- values could be calculated, then the following distributional functions are valuable. They are essentially the same as using statistical tables.
AUC or probabilities from z
A quantile from z, knowing AUC or probability pnorm(z, mean = 0, sd =1) qnorm(p, mean =0, sd =1)
AUC or probabilities from t; need to know df
A quantile from t, knowing AUC or probability; need to know df pt(ts, df) qt(p, df)
Part III. Applications.
For every set of data and research question given, use the hypothesis-testing paradigm to answer the question. An essential task is that you identify the appropriate test to use. These exercises should simulate exam conditions quite well! Use additional sheets of paper, as needed.
The problems listed below are from the text. Depending on the location in the text, you could probably guess which test to use. However, try to go at it from a naïve perspective and choose the best test on your own, irrespective of the one or more tests asked requested by the text. In other words, try to answer the question but do not use the guidance by the text to use a particular test over another.
The problems to answer are the following:
7.S.5
7.S.18
8.S.12
8.S.19
8.S.20
Also, try answering these
If a population has a mean of 20 and a standard deviation of 5, what is the probability of drawing a sample of size 30 with a mean as large as 22, assuming each subject in the population has equal probability of being sampled? Assume the population size is large.
Would a 90% CI of the population mean in the previous question contain the actual population mean? Would a 95% CI? A 99% CI?
4


