Good Density Lab
advertisement
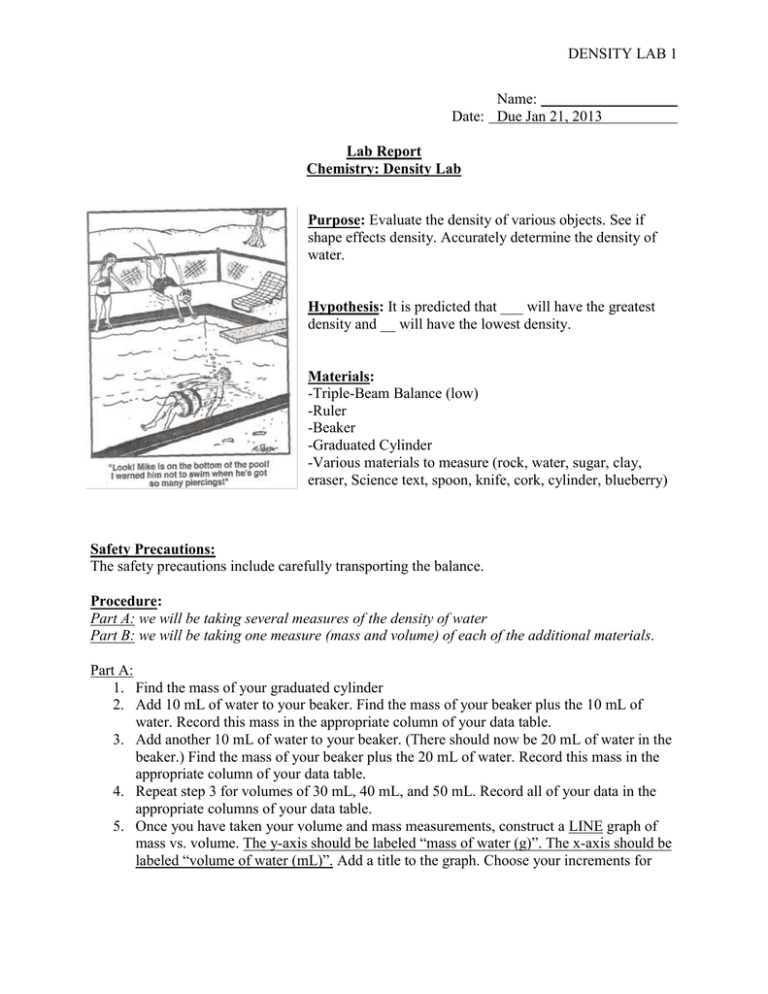
DENSITY LAB 1 Name: Date: Due Jan 21, 2013 Lab Report Chemistry: Density Lab Purpose: Evaluate the density of various objects. See if shape effects density. Accurately determine the density of water. Hypothesis: It is predicted that ___ will have the greatest density and __ will have the lowest density. Materials: -Triple-Beam Balance (low) -Ruler -Beaker -Graduated Cylinder -Various materials to measure (rock, water, sugar, clay, eraser, Science text, spoon, knife, cork, cylinder, blueberry) Safety Precautions: The safety precautions include carefully transporting the balance. Procedure: Part A: we will be taking several measures of the density of water Part B: we will be taking one measure (mass and volume) of each of the additional materials. Part A: 1. Find the mass of your graduated cylinder 2. Add 10 mL of water to your beaker. Find the mass of your beaker plus the 10 mL of water. Record this mass in the appropriate column of your data table. 3. Add another 10 mL of water to your beaker. (There should now be 20 mL of water in the beaker.) Find the mass of your beaker plus the 20 mL of water. Record this mass in the appropriate column of your data table. 4. Repeat step 3 for volumes of 30 mL, 40 mL, and 50 mL. Record all of your data in the appropriate columns of your data table. 5. Once you have taken your volume and mass measurements, construct a LINE graph of mass vs. volume. The y-axis should be labeled “mass of water (g)”. The x-axis should be labeled “volume of water (mL)”. Add a title to the graph. Choose your increments for DENSITY LAB 2 each axis wisely and don’t forget a title for your graph. (This can be done on Excel or on the grid paper below.) Part B: Write the procedure for Part B. Make sure to include how you: 1. Meaure the volume of the rock, sugar, text, and cork by_______? Explain each. 2. Determine the mass of the oil, dice, and text by __________? Explain each. 3. Challenge—can you create a boat with the clay? How many marbles will it hold?_____ Results/Observations: What happened (describe using the appropriate senses) How could you display the results using a graph (line, bar, pie) or data table? Any way you could give the results a quantitative value? Part A: Finding the Density of Water Mass of Graduated Cylinder (empty): _____________ g Volume of Water (mL) 0 10 20 30 40 50 Mass of Cylinder + Water (g) Mass of Water (g) 0 DENSITY LAB 3 1. Using the graph that you created, what would you estimate to be the mass of 45 mL of water? 2. Using the graph that you created, what would you estimate to be the volume of 35 g of water? 3. a. Using your data table, what is the mass of 10 mL of water? b. Using that mass and a volume of 10 mL, calculate the density of water. Show all of your work below and include correct units on your final answer. 4. a. Using your data table, what is the mass of 30 mL of water? b. Using that mass and a volume of 30 mL, calculate the density of water. Show all of your work below and include correct units on your final answer. 5. How do your answers of density from 4.b. and 3.b. compare? Are they close in value? 6. Looking at your answers to 4.b. and 3.b., what would you theoretically expect the answer to be if you were asked to calculate the density of 68 mL of water and had been given the mass of that amount of water? 7. What is the average density of water based on your data? 8. Include the percent error. Calculating percent error is a way to determine how well you’ve done in lab with your measurements and your calculations. Good work has very low percent error values. Not so good work has larger percent error values. To calculate percent error, use the following mathematical equation: DENSITY LAB 4 % E = Average Experimental Density of Water – Actual Density of Water (100) = Actual Density of Water 9. Bonus. Calculate the “Standard Deviation” of the mean density of water. Standard Deviation show how much variance or dispersion exists from the mean. A low standard deviation indicates that the data points tend to be very close to the mean; high standard deviation indicates that the data points are spread out over a large range of values. You must show all your work to get credit for this bonus. http://www.mathsisfun.com/data/standard-deviation.html Part B Data Table: Object Predicted Mass (g) Rock sugar eraser Science 7 text Spoon or knife Cork (cylinder) Canola oil blueberry Clay ball Clay invention (float?) How many marbles did your boat float Supporting Research: Mass (g) Predicted Volume (ml) or (cm3) Volume (ml) or (cm3) Density (g/ml) or (g/cm3) DENSITY LAB 5 Find density research that supports your results. Make sure you cite your source (name, year, website) properly. Analysis of Results: Describe why you think you got the results you did based on the research you found. If your results are off, why do you think this is the case? You may need to do this in a case-by-case or object-by-object scenario. Which masses or volumes were you able to determine the most accurately? Why? Which masses or volumes were ou able to determine the least accurately? Why? Conclusion: A brief summary of what you learned. Was your hypothesis supported or not? Did you collect enough data to make a fair conclusion? Do you need to conduct more experimentation? How could you make your study more accurate (refer to Part A and Part B)? Extensions/Importance/Applications to real-life: Describe two everyday situations in which the measurement of mass, volume, and density is important. Explain the importance. Follow-up Questions: 1. How could you use the materials provided in this lab (+ string, if needed) to prove that you can change the shape of the clay without changing the volume? Are there cases when changing the shape of the clay could change the volume? Explain. 2. If using displacement to determine volume, why would you want to slide each object into the graduated cylinder instead of dropping it in? How could your results have changed if you had dropped the object in? Explain. 3. Why do huge, heavy boats float? Be sure to explain in your own words! 4. Explain why “displacement” is an appropriate name for the method? Why is this method an example of indirect measurement? 5. A rock has a density of 4 g/ml. and a mass of 16 grams. What is the volume this rock occupies 6. A cube made of an unknown material has a height of 9 cm. The mass of this cube is 3,645 grams. Calculate the density of this cube. 7. In a container of water at room temperature (20 C), describe the approximate position of the following objects when placed in the water and explain why you placed them as you did. DENSITY LAB 6 a.) b.) c.) d.) e.) styrofoam (D = .05 g/cm3) ice (D = .92 g/cm3) bone (D = 1.70 g/cm3 balsa wood (D = 0.16 g/cm3) gold (D = 19.32 g/cm3)


