PB-I Marking Scheme Economics
advertisement
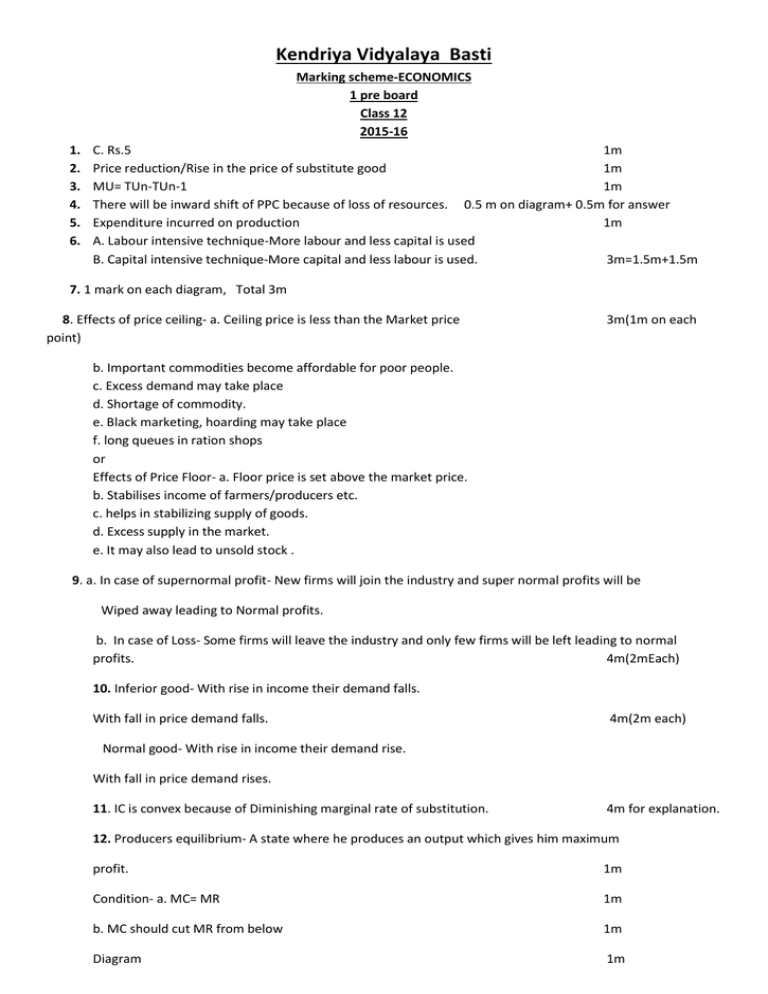
Kendriya Vidyalaya Basti Marking scheme-ECONOMICS 1 pre board Class 12 2015-16 1. 2. 3. 4. 5. 6. C. Rs.5 1m Price reduction/Rise in the price of substitute good 1m MU= TUn-TUn-1 1m There will be inward shift of PPC because of loss of resources. 0.5 m on diagram+ 0.5m for answer Expenditure incurred on production 1m A. Labour intensive technique-More labour and less capital is used B. Capital intensive technique-More capital and less labour is used. 3m=1.5m+1.5m 7. 1 mark on each diagram, Total 3m 8. Effects of price ceiling- a. Ceiling price is less than the Market price point) 3m(1m on each b. Important commodities become affordable for poor people. c. Excess demand may take place d. Shortage of commodity. e. Black marketing, hoarding may take place f. long queues in ration shops or Effects of Price Floor- a. Floor price is set above the market price. b. Stabilises income of farmers/producers etc. c. helps in stabilizing supply of goods. d. Excess supply in the market. e. It may also lead to unsold stock . 9. a. In case of supernormal profit- New firms will join the industry and super normal profits will be Wiped away leading to Normal profits. b. In case of Loss- Some firms will leave the industry and only few firms will be left leading to normal profits. 4m(2mEach) 10. Inferior good- With rise in income their demand falls. With fall in price demand falls. 4m(2m each) Normal good- With rise in income their demand rise. With fall in price demand rises. 11. IC is convex because of Diminishing marginal rate of substitution. 4m for explanation. 12. Producers equilibrium- A state where he produces an output which gives him maximum profit. 1m Condition- a. MC= MR 1m b. MC should cut MR from below 1m Diagram 1m Explanation 2m=total 6 13. Change in supply- It is because of change in factors other than price. Change in quantity supplied- It is because of change in price. total 6m=1m on each point of difference 14. There can be three situationsa. Price may remain constant b. Price may rise. C. Price may fall. on explanation of each Total6=3m on three diagrams+3 m 15. Consumer’s equilibrium- A consumer is in equilibrium when he gets maximum satisfaction from his expenditure with given income and prices. 1m Equilibrium condition- Slope of Budget line= Slope of price line Diagram 1m Explanation 3m 1m 16. Those bank deposits which can be withdrawn through cheques. 1m 17. (b.)-lack of store of value 1m 18. (d.) –Distribution method 1m 19.Primary deficit=Fiscal deficit –interest payments 1m 20. (d.) –Capital expenditure 1m 21. It is a combination of Mixed exchange rate system and Floating exchange rate system. 3m 22. C=c+b.Y 1m c=Rs.100(b-MPC) MPC=0.70 Y=1000 100+0.7 X 1000 1m 100+700 C= Rs. 800 23. Equlibrium equation- Y*= AD=AS 1m 1m Diagram 1m Explanation -National income will be in equilibrium where AD=AS. 1m 24. Real GDP-GDP measured at base year price. Quantity of goods in current year x price of base year 2m Nominal GDP- GDP measured at current year price Quantity of goods in current year X price of current year 25. a. Foreign currency 2m 1m b. Value of home currency in terms of foreign currency 1m c. An account of all economic transactions of a country with rest of the world in a financial year. 1m d. BOT= Value of export- value of imports 26. GVA at Market price= Value of output- intermediate consumption 1m 1m Value of output= sales+change in stock Sales= price X units of output Or 30x1000=30 000 Change in stock= closing stock- opening stock =3000-2000=1000 =(30000+1000)-12,000 =31,000-12,000 =19,000 1m GVA at FC= GVA at MP- Net indirect tax (excise+ sales tax) 1m =19,000-(2500+3500) =19000-6000 =13000 1m 27. Fiscal deficit= Total expenditure- Total revenue(excluding borrowings). 1m Implications- a. Heavy borrowings b. Burden on future generations c. Increase in the liability of govt. d. Inflation e. Hampers future growth 1m on each 28. CRR-Minimum percentage deposits to be kept by the commercial banks with the central bank. 1m SLR-Minimum percentage of deposits to be kept by the commercial banks with itself. 1m An increase in LRR(CRR+SLR) reduces the capacity of commercial banks to create credit. 29. Diagram Steps - We draw a 45 degree line passing through the origin. 4m on explanation 1m 3m Consumption is equal to the difference between income and saving. The point where C=Y is called break even point. When income is less then consumption we consume from our past savings. showing income level where APC=1 1m showing income level where APS= negative 1m 30. (i) NDP at MP= Private final consumption expenditure + Govt. final consumption expenditure+ net domestic fixed capital formation + change in stock + net export 1m =600+200+110+(-10)+20 =920 NNP at FC =NDP at MP + NFIA –Net indirect tax 1m =920+(10)-70 =920-80 =840 1m (ii). NNDI= NDP at MP + NFIA- net current transfers to abroad 1m 920+(-10)-(-5) 1m 920+5-10 =915 ………………………………………………………………..xxxxxxxxx……………………………………………………………… 1m

