Stem-and-Leaf Plot Lesson Plan
advertisement
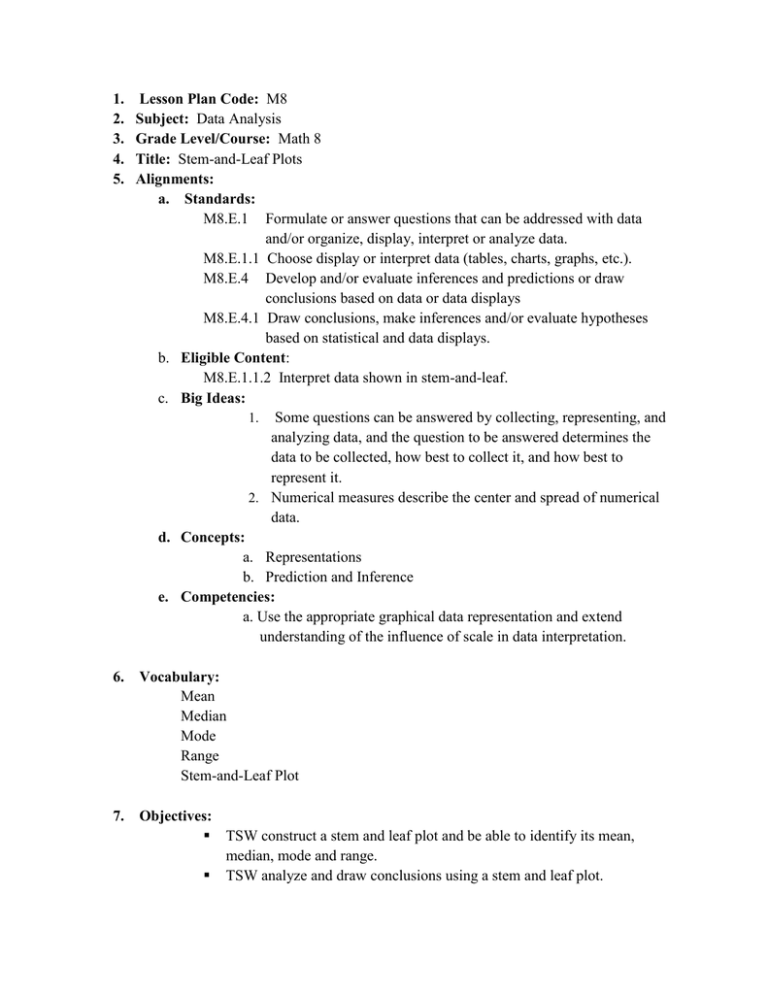
1. 2. 3. 4. 5. Lesson Plan Code: M8 Subject: Data Analysis Grade Level/Course: Math 8 Title: Stem-and-Leaf Plots Alignments: a. Standards: M8.E.1 Formulate or answer questions that can be addressed with data and/or organize, display, interpret or analyze data. M8.E.1.1 Choose display or interpret data (tables, charts, graphs, etc.). M8.E.4 Develop and/or evaluate inferences and predictions or draw conclusions based on data or data displays M8.E.4.1 Draw conclusions, make inferences and/or evaluate hypotheses based on statistical and data displays. b. Eligible Content: M8.E.1.1.2 Interpret data shown in stem-and-leaf. c. Big Ideas: 1. Some questions can be answered by collecting, representing, and analyzing data, and the question to be answered determines the data to be collected, how best to collect it, and how best to represent it. 2. Numerical measures describe the center and spread of numerical data. d. Concepts: a. Representations b. Prediction and Inference e. Competencies: a. Use the appropriate graphical data representation and extend understanding of the influence of scale in data interpretation. 6. Vocabulary: Mean Median Mode Range Stem-and-Leaf Plot 7. Objectives: TSW construct a stem and leaf plot and be able to identify its mean, median, mode and range. TSW analyze and draw conclusions using a stem and leaf plot. TSW construct a stem and leaf plot given any form of raw data. 8. Essential Questions: a. How can you choose a scale for your graphs so that the graph best represents a situation? b. How can we choose a scale so that the chosen scale distorts the data or misleads the reader? 9. Duration: 45-minute class period 10. Materials: Index Cards Colored Pencils/markers Dice (one die per group) Homework Worksheet 11. Suggested Instructional Strategies: Direct Instruction, Cooperative Learning, Independent Practice 12. Instructional Procedures: 1. Warm-up - An index card will be on each student’s desk before they walk into the classroom. Each student will write their favorite number on the index card. Students will hang their favorite numbers on the blackboard. This will be a data set for later in the lesson. 2. Review properties of a stem and leaf plot. After discussing how the stem and leaves are connected and reviewing place value, show the students examples of stem and leaf plots. 3. Using the data from the warm-up, create a class stem and leaf plot. Using a few examples have the class guide in the construction of the stem and leaf plot of their favorite number. Have volunteers come up to the board to finish the stem and leaf plot. 4. Review the definitions of mean, median, mode, and range. 5. Each student will time each other to see how many seconds it takes to copy a sentence with your dominant hand and again with your non-dominant hand. Create a stem-and-leaf plot and also a back-to-back-stem-and-leaf plot with the given information. “One way I can organize data is by making a stem-and-leaf plot.” 6. Time Permitting: Students will then be paired up and will work together. Hand out construction paper and dice. Have the students create 15-20 numbers by rolling dice. The first roll will be the tens place and the second roll will be the ones place. (For example, the first roll is a 5 and the second roll is a 2. The first number of their data set would be 52.) They will then plot their numbers on a stem and leaf plot. If you were to roll two die and got the number 12 and then 3 to make the number 123, how would it be represented in your stem and leaf plot? 7. Using a piece of notebook paper, students will briefly respond to the question, “Why is this method of displaying data so efficient? What makes it easy to read and easy to draw information from?” 8. Students will complete stem- and-leaf plot handout. 13. Formative Assessment: The students’ response to the question will help to assess how well the students understood the material. Based on the depth of detail used in their response, their understanding can be evaluated. The group work will assess the class’ abilities to represent data correctly in a stem and leaf plot and draw conclusions from the display. 14. Related Material & Resources:


