mapping our world
advertisement
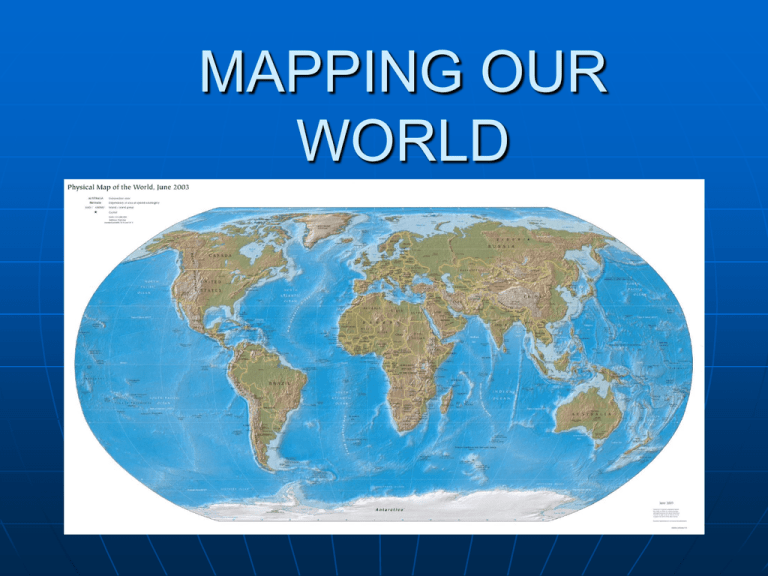
MAPPING OUR WORLD MAPPING Cartography• science of map making Maps *Flat models of 3-dimensional spaces **Earth is always distorted on maps Typical Graph This is an example of a typical graph we are all familiar with. The graph is made up of different “points” with lines that connect the points. The points are referenced to the x and y axis Maps are Similar to Graphs N W E S Let each of the four quarters be designated by North or South and East or West. What are the 0 points? Equator – • Separates the Earth into two equal halves called the northern hemisphere and the southern hemisphere • It is an imaginary belt that runs halfway point between the North Pole and the South Pole. Equator What are the O points? P M Prime Meridian – • Divides the Earth running North -South • Separates the Earth into two halves – the Eastern hemisphere and the Western hemisphere • Goes through Greenwich, England – home of Royal Naval Observatory E R I I D M I E A N R East West, North South on the Earth (N, W) (N, E) (S, W) (S, E) The N tells us we’re north of the Equator. The S tells us we’re south of the Equator. The E tells us that we’re east of the Prime Meridian. The W tells us that we’re west of the Prime Meridian. Latitude and Longitude The earth is divided into lots of reference lines called latitude and longitude. What is Latitude? 90°N Y X 90°S Latitude is the distance from the equator along the Y axis. Lines running parallel to equator Measures NORTH – SOUTH, but runs EastWest All points along the equator have a value of 0 degrees latitude. North pole = 90°N South pole = 90°S Values are expressed in terms of degrees. What is Latitude? Each degree of latitude is divided into 60 minutes. Each minute is divided into 60 seconds. X Ex: coordinates of Sunny Hills HS 33°52′48″N 117°55′43″W 90°N Y 90°S This is also true of longitude. What is Longitude? Y X 180°W 180°E Longitude is the distance from the prime meridian along the X axis. Lines running parallel to Prime Meredian Measures EAST – WEST, but runs North-South All points along the prime meridian have a value of 0 degrees longitude. The earth is divided into two parts, or hemispheres, of east and west longitude. What is Longitude? Y X 180°W 180°E The earth is divided into 360 equal slices (meridians) 180 west and 180 east of the prime meridian The Size of 1o Latitude • degree of latitude is approximately 69 miles, and a minute of latitude is approximately 1.15 miles Longitude • A degree of longitude varies in size – it decreases to zero as meridians come together at the poles • At the equator, it is approximately 69 miles, the same size as a degree of latitude. • At a latitude of 45 degrees, a degree of longitude is approximately 49 miles. Coordinate System Time Zones The Earth is divided into 24 time zones • Each time zone is 15˚ wide • There are 6 different time zones in the U.S. Rotation The Earth rotates 15o of longitude every hour 24 lines of longitude (24 hours) in one day 15 x 24 = 360o total (full circle) • 180o longitude on each side of Prime Meridian International Date Line The International Date Line, or 180˚ meridian, serves as the transition line for calendar days • If you were traveling west across the IDL, you would advance your calendar one day. • If you were traveling east across the IDL, you would move your calendar back one day. See If You Can Tell In Which Quarter These Lon/Lats Are Located A B C D 1. 2. 3. 4. 5. 6. 41°N, 21°E 37°N, 76°W 72°S, 141°W 7°S, 23°W 15°N, 29°E 34°S, 151°E 1. 2. 3. 4. 5. 6. B A C C B D Mercator Projection Parallel lines of latitude and longitude • Area of land masses near the poles are exaggerated Used for navigation of planes and ships Conic Projections Points and lines on a globe are projected onto a cone-shaped paper. Little distortion in the areas or shapes of landmasses that fall along this line of latitude • Distortion is evident near top and bottom of the projection • Useful for road maps & weather maps Gnomonic Projections Points and lines from a globe are projected onto a paper that touches the globe at a single point. • Distort direction and distance between landmasses Useful in plotting long-distance trips by air and sea Topographic Maps Topographic Map Show changes in elevation of Earth’s surface Also show, mountains, rivers, lakes, forests, etc. Features of Topographic Maps Relationship between 3D and 2D representation 3D view 2D view Contour Lines • Contour lines drawn on a map give the elevations for a region. • Where the lines are close, the slope of the ground is steep. • Where the lines are far apart, the slope of the ground is gentle. Contour Lines Imaginary lines that connects points of equal elevation (height above sea level) Contour Lines contour lines do not intersect, branch or cross, except in a vertical or overhanging cliff. When contour lines cross a stream, they form a “V” with the point of the V pointing upstream Contour Interval The difference in elevation between two side-by-side lines Each map has a unique contour interval, so locate label on the map Index Contours • Some contour lines are marked by numbers representing their elevations. • Practice! • What is the elevation of the line that is left of the 100m index contour. Depression Contour Lines When the elevation is lower than the surroundin g area there are “hachures” on the line Contour Map Example On this map, the vertical distance between each of the contour lines is 10 feet. 1.Which hill is higher, hill A or hill B? 2.Which hill is steeper, hill A or hill B? 3.How many feet of elevation are there between contour lines? 4.How high is hill A? Hill B? 5.Are the contour lines closer on hill A or hill B? Map Legends A map legend explains what the symbols on a map represent Map Scales Definition A means of showing the relationship between the size of an object indicated on a map and the actual size of the object on the surface of Earth. Scale Types Fractional scale: - is a fixed ratio between linear measurements on the map and corresponding distances on the ground. Example: 1:62,500 Graphical scale: - is simply a line or bar drawn on the map and divided into units that0 represent ground distances. 1 1 2 3 4 Miles Example: Verbal scale: - is a convenient way of stating the relationship of map distance to ground distance. Example: 1 inch equals 1 mile Remote Sensing • The Electromagnetic Spectrum The arrangement of electromagnetic radiation according to wavelengths • Frequency refers to the # of waves that pass a particular point each second Wave Characteristics • Electromagnetic waves travel at the speed of 300,000 km/s in a vacuum “The Speed of Light” Topex/Poseidon Satellites An emitter sends outgoing signal to the surface of the ocean A receiver times the returning signal Distance to ocean’s surface is calculated using the known speed of light and the return time. Landsat Satellite Receives reflected wavelengths of energy emitted by Earth’s surface, such as rivers and forests GPS A radio-navigation system of at least 24 satellites that allows its users to determine their exact location on Earth. The receiver calculates the user’s precise lat/long by processing the signals emitted by multiple satellites. Sea Beam Used to map the ocean floor Located on a ship rather than a satellite Uses sonar which is the use of sound waves to detect and measure objects under water.
