Risk Management
In the Wake of the Great Financial Crisis
www.lawrencegmcdonald.com
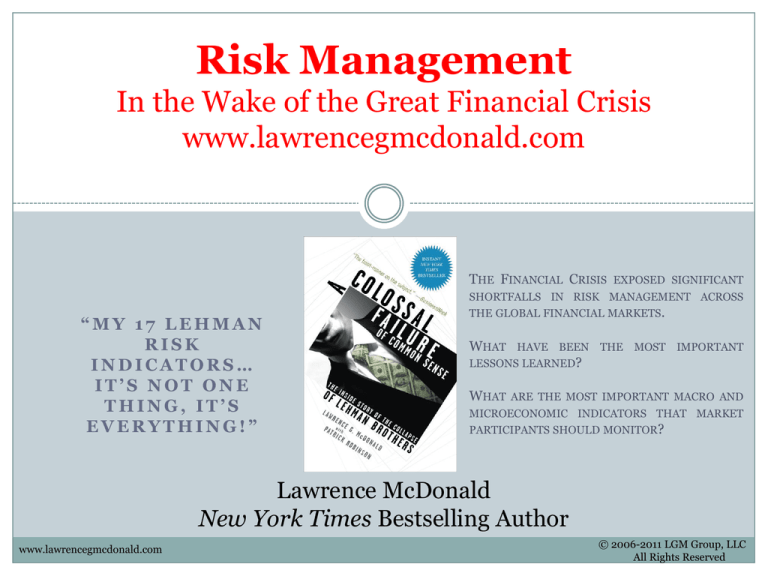
THE FINANCIAL CRISIS EXPOSED SIGNIFICANT
“MY 17 LEHMAN
RISK
INDICATORS…
IT’S NOT ONE
THING, IT’S
EVERYTHING!”
SHORTFALLS IN RISK MANAGEMENT ACROSS
THE GLOBAL FINANCIAL MARKETS.
WHAT HAVE BEEN THE MOST IMPORTANT
LESSONS LEARNED?
WHAT ARE THE MOST IMPORTANT MACRO AND
MICROECONOMIC INDICATORS THAT MARKET
PARTICIPANTS SHOULD MONITOR?
Lawrence McDonald
New York Times Bestselling Author
www.lawrencegmcdonald.com
© 2006-2011 LGM Group, LLC
All Rights Reserved
Lehman Brothers’ Stock Chart
Lehman Brothers’ Chairman & CEO
Richard S. Fuld, Jr.
Lehman Brothers’ Board Members
Corporate Governless
They had an average age of 70
overseeing $750 billion of systemic risk
Corporate Governance:
What’s Needed?
•Term Limits for CEOs and Board Members (2 Board Max)
•Risk Committee Members on Board
•More Woman on Boards, 15% is Unacceptable
•Former CEOs as Board Members
•Smaller Boards: 2008 S&P 500 11.8 members vs. 6 or 7 needed
•More 21st Century Expertise: 1 of 16 Citigroup Board Members was in Finance in
2007
•Annual Time Commitment Needs to be Longer
•More Meetings: No More “Once a Month Finger Sandwiches Luncheons”
•Board Meetings Without Management
•Higher Compensation for More Time and Experience
Risk Indicators
Macro
•H i g h Y i e l d C r e d i t S p r e a d s
•E q u i t i e s v s . H i g h Y i e l d
•3 M o n t h L i b o r / R e a l i z e d V o l a t i l i t y o f 3 M o n t h L i b o r
•T e d S p r e a d / T e d S p r e a d R e a l i z e d V o l a t i l i t y
•3 M o n t h E u r i b o r / 3 M o n t h E u r i b o r R e a l i z e d V o l a t i l i t y
•I n t e r b a n k O v e r n i g h t 1 0 , 3 0 , 6 0 , 9 0 , 3 6 0 d a y C D M a r k e t
•2 Y e a r S w a p S p r e a d / R e a l i z e d V o l a t i l i t y o f t h e 2 Y e a r
Swap Spread
•A s s e t Q u a l i t y i n R e p o s a n d M o n e y M a r k e t F u n d s
•I n v e s t o r s I n t e l l i g e n c e B u l l i s h n e s s / B e a r i s h n e s s S u r v e y
•N Y S E S h o r t I n t e r e s t
•C a l l P u t V o l u m e R a t i o
•H i g h Y i e l d M u t u a l F u n d I n f l o w s
•E q u i t y M u t u a l F u n d I n f l o w s
•C a p i t a l M a r k e t s I s s u e r P o w e r & W e a k n e s s
•C o r p o r a t e D e f a u l t R a t e
•S t o c k s a t n e w 5 2 W e e k H i g h s a n d L o w s
•B r e a k o u t i n C o r r e l a t i o n
Risk Indicators
Micro
•Y e s M e n ? S t r a n g e m a n a g e m e n t c h a n g e s : b o t h L e h m a n B r o t h e r s a n d M F G l o b a l h a d t h e i r
respective risk management heads replaced within 24 months of filing
bankruptcy. Insecure CEO's often cannot deal with any intellectual challenges. Dick
Fuld's entire top tier of lieutenants, were the ultimate yes men. If you were lucky
enough and courageous enough to make his team it was the equivalent of hitting the
lottery, $15-$30 million a year was your reward.
•T o o m u c h p o w e r ? A C E O b e y o n d r e p r o a c h : D i c k F u l d ( L e h m a n ) , J o h n C o r z i n e ( M F
Global), Jimmy Cain (Bear Stearns), Jeff Skilling (Enron), Gary Wendt (Conseco), Al
Dunlap (Sunbeam) all share so many personality traits. Yet above all, 12 months
before their companies filed bankruptcy (or had to be saved), these leaders seemed
invincible to the outside world. Sun Tsu in the Art of War said, "If an emperor lives in
fear of his own men it's a sign of supreme incompetence.”
•F u n d i n g M i s M a t c h : A h i g h p e r c e n t a g e o f l i a b i l i t y f i n a n c i n g i n t h e s h o r t t e r m d e b t
markets has brought so many companies to their knees. It's the time tested banking
principle, never fund long term illiquid investments in the short term debt
markets. Lehman, MF Global, Bear Stearns and almost Jefferies.
•B o a r d o f D i r e c t o r s o u t o f t h e i r o w n D e p t h : a b o a r d w i t h a h i g h p e r c e n t a g e o f m e m b e r s
who know little to nothing about the business as hand.
indicator, Dina Merrill?
•W h a t ' s a C L O ?
Seems obvious but it's a deadly
Strange corporate positions of power.
•I m a g i n a t i v e U s a g e o f t h e R e p o M a r k e t : w h a t d o R e p o 1 0 5 a n d R e p o t o M a t u r i t y h a v e i n
Risk Indicators
Micro
•D i f f i c u l t t o B o r r o w L i s t
•A g g r e s s i v e e x p a n s i o n i n t o n e w b u s i n e s s l i n e s : L e h m a n i n 2 0 0 7 h a d b e c o m e a r e a l
estate investment trust with an investment bank on the side. In 2010, MF Global went
from a riskless agency broker model to an investment banking model with a large focus
on proprietary trading.
•C a n y o u p l a y P o k e r ? C o r p o r a t e a c t i o n s d e s i g n e d t o s h o w s t r e n g t h a n d h i d e
weakness. Late Q4 2007, 9 months before filing bankruptcy, Lehman Brothers was
raising its dividend and buying back stock > $80 a share. Merrill Lynch and others
were selling stock to raise equity capital. Didn't fool David Einhorn.
•L e v e r a g e : L e h m a n , A I G , F a n n i e M a e a n d M F G l o b a l w e r e a l l l e v e r e d 4 0 + t i m e s .
•C h a r l i e M u n g e r . A l i t t l e t o o C o z y w i t h y o u r A u d i t o r ?
Lehman had 4 CFO's from 2004-
2008, two of them used to work for their auditor.
•A g g r e s s i v e u s e o f t h e C o n v e r t i b l e D e b t C a p i t a l M a r k e t s : S i n o F o r r e s t , A m e r i c a n
Airlines, Delta Airlines, Northwest Airlines, Lehman Brothers, MF Global, Enron,
Adelphia, Calpine, Worldcom, Fannie and Freddie, Six Flags, Tower Automotive, Six
Flags and Sunbeam all issued convertible debt securities just prior to bankruptcy.
•" F o l l o w t h e I n c e n t i v e s " C h a r l i e M u n g e r . F u l d w a t c h e d P e t e P e t e r s o n a n d S t e v e
Schwarzman become billionaires.
become Treasury Secretary.
Corzine watched Bob Rubin and Hank Paulson
•T h e D e a d l i e s t T r a d e : L o n g t h e I l l i q u i d a n d S h o r t t h e L i q u i d ,
Lehman, Bear Stearns &
University of Chicago Political Uncertainty Index
VIX Slayed by Fed and ECB Policy Blows
High Correlation Amongst
Stocks in the S&P 500
•T h e 5 0 - D a y c o r r e l a t i o n o f S & P 5 0 0 s t o c k s t o g a i n s o r l o s s e s i n
the full index increased to a record 0.86 in October, according
to Birinyi Associates Inc. It was 0.83 in the days around
Lehman’s failure.
•A l e v e l o f 1 w o u l d m e a n a l l 5 0 0 s t o c k s m o v e d t o g e t h e r .
•A u g u s t - S e p t e m b e r 2 0 0 8 a n d S u m m e r 2 0 1 1 , h i g h c o r r e l a t i o n
existed across all asset classes. A breakout in the ICJ, the
CBOE S&P 500 Implied Correlation Index, which occurred on
J u l y 1 1 th, 2 0 1 1 & S e p t e m b e r 2 n d , 2 0 0 8 , i s v e r y b e a r i s h .
•I n t h e 1 9 9 0 s a n d 2 0 0 4 - 2 0 0 7 t h e r e w a s v e r y l i t t l e c o r r e l a t i o n
amongst all asset classes.
Correlation Near Multi Year
Lows
CBOE S&P 500
Implied Correlation
Index…
When near all time
lows, beware of
coming Risk Off train
Correlation in
uptrend, is a solid
Risk Off indicator
Systemic Risk and
US Treasury Yields
are inversely
correlated,
commodities as well
On July 24th Spain’s 2 year
note yield topped out at
6.6%, after Draghi hinted he
had a Bazooka in the OMT,
yield came in to 2.7%.
Over the last 3 years as this
curve flattens, it makes
sense to take down risk in
equities.
July 24th 90bps Spread –
Sept 5th 346bps Spread
European banks pledged to
de-lever by $1.3 trillion last
year but assets grew by 7%
to $45 trillion, 3x GDP of
$15 trillion.
Draghi’s new OMT & LTROs
are looking more and more
like the Bear Stearns
bailout, Spanish and Italian
banks should be de-levering
but their not. MORAL
HAZARD anyone?
The Epicenter of Global Systemic
Risk.. Spain 2s / 10s Has Been a
Spot On Indicator
Lehman Like Risk in Spain?
All Year, Spain’s 10
Year yield has been
inversely correlated
to US Treasuries.
Systemic Risk and
US Treasury yields
are at opposite ends
of the see saw.
The US faces a 200
bps rise in long term
rates when
deflationary,
depression like
systemic risk is
reduced in Europe.
Euribor Early Indicator
Euribor broke out on
July 12th 2011.
From July 25th through
September 2nd the
S&P 500 lost 19%.
Just as in 2008,
Euribor was
screaming sell.
In 2012, she was
saying buy. From its
July breakout do the
downside, stocks are
up 9%
Equities vs. High Yield
+17.97%
+9.13%
Extended period
of equity out
performance
relative to
HY. The more
illiquid the asset
class the better
the indicator.
July 15, 2008-September 18, 2008
+1.27%
July 15, 2008-September 1, 2008
From July 14, 2008January 27, 2009, HY
CDX was +1.27%
S&P 500 Summer 2008
Equities Outperforming High Yield:
S&P 500+7.25%, JNK -0.91%,
July 16, 2008-September 3, 2008
+7.25%
JNK SPDR Barclays Capital High Yield Bond ETF
-0.91%
Realized Volatility of 3 Month Libor
•3 Month Libor has
always been a solid
indicator of bank trust
in one another, but
looking at realized
volatility of 3 month
Libor gives you even
more lead time to take
down risk. There
were significant
spikes just before the
2008 Lehman & 2011
MF Global /
Eurozone) crashes.
•Significant spike just
before the 2008 &
2011 crashes.
2008
July 1, 2008-May 31, 2009
2011
April 1-October 31, 2011
Breakout
Breakout
Ted Spread
Excellent indicator, significant spike just before the 2008 & 2011
crashes. When institutions would rather but there money in Treasuries
vs. a financial institution look out. Early volatility is the key.
Realized Vol on Euribor Today
Even with all the
ugly headlines out
of Europe, so far
the LTRO love is
paying off for
Interbank Trust
Interbank Overnight
10, 30, 60, 90, 360 Day CD Market
•B o t h i n 2 0 0 8 & 2 0 1 1 b a n k s w e n t f r o m l e n d i n g f o r a
year to each other to just overnight in some cases
•I n t h e S u m m e r o f 2 0 1 1 , s e v e r a l m a j o r E u r o p e a n
banks could not fund themselves for more than 10
days, yield spreads in secondary market trading of
these short term loans went from 45 bps to 190 bps
in just a few weeks.
2008 ELEPHANTS FOOTPRINTS IN RISK
REDUCTION MODE
Realized Volatility
in 2 Year Swaps was
breaking out 7 days
prior to Lehman
Brothers’
bankruptcy
2 Year Swap Spread
30 Day Realized Volatility on 2 Year Swap Spread
2 Year Swap Spread
•Demand for
dollars especially
from European
Banks was a
significant risk
indicator in the
Spring & Summer
of 2011, as well as
2008.
•Demand for US
dollars to buy US
Treasuries.
•In June 2011, the 2
Year Swap Spread
spiked 44% in a two
day period before
equities rolled over
hard in July.
January 1-October 31, 2011
+44%
EONIA in the Spring of 2011 & 12
Euro
Overnight
Index
Average,
effective rate
of all
overnight
unsecured
lending
transactions
in the
interbank
market
EONIA
EONIA (Euro
Overnight Index
Average) is an
effective overnight
unsecured lending
rate, transactions in
the interbank market
Uptrends in 2008 and
2011 were reliable
Risk Off indicators…
Downtrend in 2012
was a bullish risk on
preview
NYSE Short Interest
A breakout in short interest is
bearish, the shorts should be
listened to.
A breakout in short interest of one
or more systemically important
financial institutions is even more
telling. This took place in the
summer of 2008 & 2011.
According to the recent NYSE
biweekly update, the short interest
as of the end of 2011 was a modest
12.8 billion shares, a sharp drop
from the 13.4 billion and 14.2
billion 2 and 4 weeks prior, and
certainly a very far cry from the
over 16 billion shares short which
market the market bottom in late
September.
Call/Put Volume Ratio
Contrarian-sentiment measure
known as the put/call options
volume ratio. By tracking the daily
and weekly volume of puts and
calls in the U.S. stock market, we
can gauge the feelings of traders.
While a volume of too many put
buyers usually signals that a
market bottom is nearby, too many
call buyers typically indicates a
market top is in the making.
When speculation in calls gets too
excessive, the put/call ratio will be
low.
When investors are bearish and
speculation in puts gets excessive,
the put/call ratio will be high. A
breakout in the skew is even more
telling.
Asset Quality in Repos and Money Market Funds
In late 2006 / early 2007 the asset backed commercial paper market was the
first warning sign, major money market funds started to shun abcp, this
market was screaming "Iceberg Ahead." Its all about convexity, the market
with the most convexity (downside vs. upside) is always the first to de-risk.
"Are you long because you like it, or do you like it because you're long?”
-Mike Gelband to Dick Fuld November 2006
Investors Intelligence Bullishness / Bearishness Survey
When everyone is bullish it's time to take off some risk.
Sour Financials…
In 2008, the XLF
was severely
underperforming, 27%, while SPX was
down -13%.
•In 2011, the XLF
was again
severely
underperforming,
-5%, while SPX
was +6%.
•The same applies
if Financials are
underperforming
in Equities and
Credit.
•Flashing
Yellow…
High Yield Mutual Fund Inflows
As retail investors with a thirst for yield start piling into high yield bonds in a
big way, this is a great contra indicator. In looking a this data in a basket
with others and not alone, it helps solve another piece to the puzzle as to
when de-risk.
Equity Mutual Fund Inflows
By themselves this contra indicator is not all that helpful. Equity inflows in
size can go on for a long time. Extreme high levels of outflows are a good
indication of a market bottom.
2012 Elections and
“Fiscal Cliff”
2012 Presidential Election
AK
NH(4)
WA
MT
VT
ND
MN
OR
MI
WY
NV
(6)
IA
(6)
NE
UT
CA
AZ
CO
(9)
IL
OK
NM
Safe R (21 States, 170 Electoral Votes)
Leans R (3 States, 36 Electoral Votes)
Tossup (8 States, 95 Electoral Votes)
Leans D (5 States, 58 Electoral Votes)
Safe D (13 States, 179 Electoral Votes)
NJ
OH
(18)
DE
KY
MO
TN
TX
LA
AL
VA
(13)
NC
MD
SC
AR
MS
HI
IN
RI
CT
PA
WV
KS
MA
NY
WI
(10)
SD
ID
ME
GA
Obam
a
Romney
237
206
FL
(29) 270 Votes Needed to
Win
Electoral math is an
uphill battle for Romney
32
© 2012
2011 ACG-Analytics All rights reserved.
2012 Senate Races
NH
AK
WA
MT
VT
ND
MN
OR
MI
WY
IA
NV
NE
UT
CO
CA
IL
IN
NJ
OH
DE
VA
KY
MO
RI
CT
PA
WV
KS
MA
NY
WI
SD
ID
ME
MD
NC
AZ
OK
NM
TN
MS
HI
Safe R (5)
Leans R (3)
Tossup (8)
Leans D (9)
Safe D (8)
TX
SC
AR
AL
GA
LA
FL
For control of the Senate, Republicans need to pick up 3-4 seats
depending on whether President Obama is reelected. Republicans are
likely to lose Maine, and must hold Massachusetts, Nevada, &
Arizona. The margin for control is razor-thin.
33
© 2012
2011 ACG-Analytics All rights reserved.
2012 House Races
NH
WA
MT
VT
ND
MN
OR
MI
WY
190
NV
IA
UT
CO
CA
IL
KS
IN
151
NJ
OH
DE
WV
VA
KY
MO
RI
CT
PA
44 13 37
NE
MA
NY
WI
SD
ID
ME
MD
NC
AZ
OK
NM
TN
MS
HI
TX
SC
AR
AL
GA
LA
FL
Democrats need to pick up 25 seats in order to
gain control, but a gain of more than 10 seats
currently looks difficult.
34
© 2012
2011 ACG-Analytics All rights reserved.
Fiscal Cliff – What’s on the Table?
Bush Tax Cuts & AMT Fix $320 Billion
(including taxes on dividends)
Sequestration $95 Billion
Tax Extenders
Payroll Tax Holiday $115 Billion
Unemployment Insurance $50 Billion
Investment Tax Incentives $40 Billion
Doc Fix $25 Billion
New Taxes from Affordable Care Act $25 Billion
Debt Ceiling is NOT expected to play into lame
duck negotiations
Lower Taxes and Higher Taxes = $665 Billion
35
© 2012
2011 ACG-Analytics All rights reserved.
Key Variables that Feed into Fiscal
Cliff Outcome
Election Results
Economic Growth Trend
Personalities and Post-Election Political Posturing
36
© 2012
2011 ACG-Analytics All rights reserved.
Baseline Predictions
Sequestration impact will begin to be felt at the
start of the 2013 fiscal year, October 1st
Debt ceiling resolution in 1Q 2013 will likely mitigate the full impact of spending cuts
Bush Tax Cuts may expire due to Congressional
gridlock
Obama will shift focus if he wins a second term from short-term election objectives to long-term legacy
objectives
Under current law, the federal government is scheduled to implement a fiscal tightening of
unprecedented severity at the start of 2013. Over $400 billion of tax cuts roll off and more than $200
billion of spending declines, near 5% of GDP.
Expiration creates incentives for comprehensive tax reform in 2013
Expiration helps Democrats by allowing them to start negotiations with high revenues AND by
building in a stimulus in 2014 if tax reform succeeds
U.S. sovereign credit rating is at risk of further downgrade without evidence of long-term fiscal
sustainability
Withholdings from paychecks will go into effect immediately, unless a deal is reached by year end
Increased dividend taxes could increase volatility in income-yielding equities and may drive investors
to fixed income
37
© 2012
2011 ACG-Analytics All rights reserved.
Other Fiscal Cliff Issues
Tax extenders – some provisions may be passed,
others are allowed to lapse
Uncertainty over 2012 retroactivity
AMT (Alternative Minimum Tax) is patched
Payroll tax holiday expires
Unemployment Insurance – expires or continues to
be reduced
Doc Fix – a short-term (3-6 months) deal
38
© 2012
2011 ACG-Analytics All rights reserved.
Capital Markets Issuer Power & Weakness
Issuers of debt & equity gaining more power over investors is a classic risk
indicator. In the spring of 2008, Lehman Brothers was able to issue $6 billion
in convertible preferred stock and equity. On the convertible preferred,
Lehman was able to get 7% up 35% terms in the public capital markets.
Warren Buffett wanted 10% up 10%, he didn't get it as talks broke
off. Covenant light deals were extremely popular in late 2007 at the top of the
market as well.
Corporate Default Rate
Moody’s global speculative-grade default rate ended 2007 at 0.91%
approximately 48% lower than 2006’s year-end level of 1.74%. The
speculative-grade default rate finished the year at its lowest level since 1981
when it came in at 0.70%. The default rate for all Moody’s-rated corporate
issuers fell to 0.31% in 2007 from 0.61% in 2006, also over a two-decade low
going back to 1981. Danger Will Robinson!
“VIX Under 18!”
February 4-December 2, 2008
February 2-December 2, 2012
Stocks at New
52 Week Highs
and Lows
Peaks in NYSE New
52 week lows are a
classic buy signal.
The near 2000 all
time record after
Lehman, hopefully
will never be broken.
More telling is the
MACD on New Highs
/ New Lows, when
the 50, 100, and 200
day turn negative, it’s
a solid sell signal.
High Yield vs. Equities
From March 31-May 1, 2009, Equities were only +13.93%,
compared with HY at +21.49%
Extended
periods of High
Yield
outperformance
relative to
Equities is very
bullish for
stocks.
+13.93%
+21.49%
The Infamous Last Words…
•“ S m a r t r i s k m a n a g e m e n t i s n e v e r p u t t i n g y o u r s e l f i n a p o s i t i o n w h e r e y o u c a n ’ t l i v e t o
fight another day.” –Dick Fuld, Former CEO, Lehman Brothers, April 2008
•“ W e f i n i s h e d t h e y e a r , a n d w e r e p o r t e d t h a t w e h a d $ 1 7 b i l l i o n o f c a s h s i t t i n g a t t h e
bank’s parent company as a liquidity cushion. As the year has gone on, that liquidity
cushion has been virtually unchanged.” –Alan Schwartz, Former CEO, Bear
Stearns, March 2008
•J u s t o n e w e e k b e f o r e f u t u r e s b r o k e r a g e , M F G l o b a l , f i l e d f o r b a n k r u p t c y , t h e f i r m ’ s
Chief Financial Officer told analysts at Standard & Poor’s that its capital position had
“never been stronger.” –Henri Steenkamp, Former CFO, MF Global, October 2011
•“ T o d a y I w a n t t o s e n d a m e s s a g e o f o p t i m i s m t o a l l G r e e k s .
Our road, our path, will be
more stabilized. Our country will be in a better situation. We will be stronger.” –
George Papandreou, Former Prime Minister of Greece, July 2009
•“ W e ’ r e v e r y p r o u d t o b e p a r t o f t h e E u r o z o n e .
But this comes with obligations and it
is crucial we show the world we can live up to those obligations. – George
Papandreou, Former Prime Minister of Greece, November 2, 2011
•P o r t u g a l P r i m e M i n i s t e r s a i d t h a t P o r t u g u e s e b o n d h o l d e r s w i l l n e v e r f a c e a h a i r c u t o n
their investment as it is happening in Greece, adding the country is doing everything
in its power to fulfill all the requirements under its €78 billion bailout program.
“Portugal’s debt is perfectly sustainable.” –Pedro Passos Coelho, Prime Minister of
Legal Disclaimer
This slide presentation is a product of LGM Group, LLC and is not affiliated with Newedge in any way. Newedge does not have anything to do with the production and content of
these slides. Newedge does and seeks to do business with companies that may be covered in its research reports. As a result, investors should be aware that Newedge might have a
conflict of interest. For the avoidance of doubt, investors should note that this research report is not objective and is a marketing communication as defined by the Markets in
Financial Instruments Directive (“MiFID”). For more details, see MiFID policies on our website at www.newedge.com.
This report is for information purposes only, subject to change without notice and not to be constructed as a solicitation or offer to buy or sell any financial instruments or
securities. Newedge makes no representation or warranty that the information contained herein is accurate, complete, fair or correct or that any transaction is appropriate for any
person and it should not be relied on as such. Subject to the nature and contents of this report, the investments described are subject to fluctuations in price and/or value and
investors may get back less than originally invested. Certain high volatility investments can be subject to sudden and large declines in value that could equal or exceed the amount
invested. Futures and options, as well as certain other financial instruments, are speculative products and the risk of loss can be substantial. Consequently only risk capital should
be used to trade futures and options and other speculative products. Investors should, before acting on any information herein, fully understand the risks and potential losses and
seek their own independent investment and trading advice having regard to their objectives, financial situation and needs. This report and the information included are not
intended to be construed as investment advice. Any forecasts are for illustrative purposes only and are not to be relied upon as advice or interpreted as a recommendation.
Newedge accepts no liability for any direct, indirect, incidental or consequential damages or losses arising from the use of this report or its content. This report is not to be
construed as providing investment services in any jurisdiction where the provision of such services would be illegal.
The opinions and views expressed in this report reflect the personal views of the author(s), are subject to change without notice and do not necessarily reflect the views of Newedge.
Newedge, its officers, directors and employees may from time to time have positions, make markets or effect transactions in any investment or related investment covered by this
report. All information as well as references to prices and yields are subject to change without notice. Past results are not necessarily an indication of future performance. This
communication is intended only for use by the individual or entity to which it is addressed and may not be used in any way by or provided in whole or in part to any other person or
entity.
Please note that this analysis or report is not meant for distribution to retail clients domiciled in Singapore (i.e. a person who is not an accredited investor, expert investor or
institutional investor as defined under the Financial Advisers Act). For matters relating to these analyses or reports, Singapore recipients should contact the Singapore office by
email to disclaimer-singapore-contact@newedge.com.
If these reports are prepared by a Newedge entity outside of the United States these reports are issued solely to major US institutional investors pursuant to SEC Rule 15a-6. Any
US person wishing to discuss this report or effect transactions in any security discussed herein may do so with or through Newedge USA, LLC, 630 Fifth Avenue, Suite 500, New
York, New York 10111 (646) 557-9000. Only Newedge USA, LLC is a member of FINRA and SIPC (although SIPC only pertains to securities-related transactions and positions).
Newedge USA, LLC is a US Broker-Dealer and Futures Commission Merchant. Newedge USA, LLC does not guarantee the settlement of any trade executed pursuant to SEC Rule
15a-6.
THE DISTRIBUTION OF THIS REPORT IN CERTAIN JURISDICTIONS MAY BE PROHIBITED OR RESTRICTED BY LAW AND PERSONS WITH ACCESS TO THIS REPORT
MUST OBSERVE ANY SUCH PROHIBITIONS AND RESTRICTIONS. BY ACCEPTING THIS REPORT YOU AGREE TO BE BOUND BY THE FOREGOING.
“Newedge” refers to Newedge Group SA and all of its worldwide branches and subsidiaries. Newedge Group in France and its foreign branches are authorized by the Autorité de
Contrôle Prudentiel and Autorité des Marchés Financiers in France. Newedge Group (UK Branch) is also subject to limited regulation by the Financial Services Authority for the
conduct of its UK business. Newedge Group (UK, Frankfurt and Dubai branches) does not deal with, or for, Retail Clients (as defined under MiFID and Dubai Financial Services
Authority). Only Newedge USA, LLC is a member of FINRA and SIPC (SIPC only pertains to securities-related transactions and positions). Only Newedge Canada Inc. is a member
of the CIPF. Not all products or services are available from all Newedge organizations or personnel.

