Lab Hw#5
advertisement
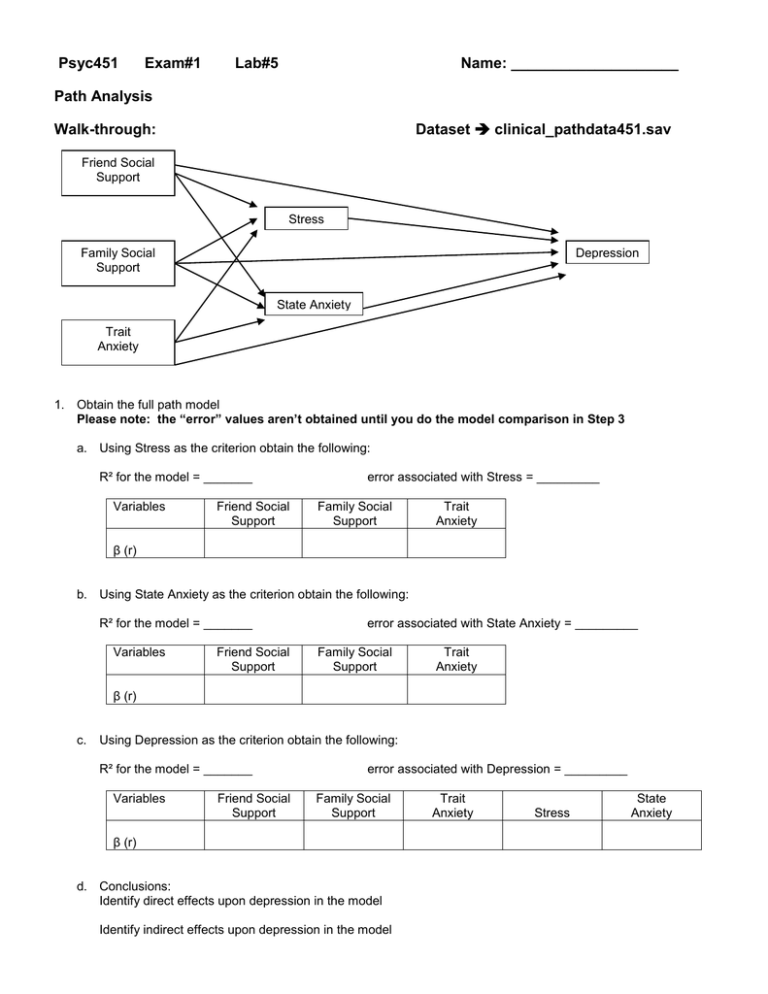
Psyc451 Exam#1 Lab#5 Name: ____________________ Path Analysis Dataset clinical_pathdata451.sav Walk-through: Friend Social Support Stress Family Social Support Depression State Anxiety Trait Anxiety 1. Obtain the full path model Please note: the “error” values aren’t obtained until you do the model comparison in Step 3 a. Using Stress as the criterion obtain the following: R² for the model = _______ Variables Friend Social Support error associated with Stress = _________ Family Social Support Trait Anxiety β (r) b. Using State Anxiety as the criterion obtain the following: R² for the model = _______ Variables Friend Social Support error associated with State Anxiety = _________ Family Social Support Trait Anxiety β (r) c. Using Depression as the criterion obtain the following: R² for the model = _______ Variables Friend Social Support error associated with Depression = _________ Family Social Support β (r) d. Conclusions: Identify direct effects upon depression in the model Identify indirect effects upon depression in the model Trait Anxiety Stress State Anxiety Friend Social Support Stress Family Social Support Depression State Anxiety Trait Anxiety 2. Obtain the hypothesized (reduced) path model Please note: the “error” values aren’t obtained until you do the model comparison in Step 3 e. Using Stress as the criterion obtain the following: R² for the model = _______ Variables error associated with Stress = _________ Trait Anxiety β (r) f. Using State Anxiety as the criterion obtain the following: R² for the model = _______ Variables Friend Social Support error associated with State Anxiety = _________ Family Social Support β (r) g. Using Depression as the criterion obtain the following: R² for the model = _______ Variables Trait Anxiety error associated with Depression = _________ Stress State Anxiety β (r) 3. Compare the two models a. N = ___________ d = __________ b. Fit of full model = _________ Fit of reduced model = __________ Q = ______ W = ______ c. Conclusion: Does removing the paths reduce the fit of the path model? p = _______ Friend Social Support Stress Depression State Anxiety Trait Anxiety 4. Obtain the “trimmed” path model (drop all non-significant paths from the full model) Please note: the “error” values aren’t obtained until you do the model comparison in Step 5 h. Using Stress as the criterion obtain the following: R² for the model = _______ Variables error associated with Stress = _________ Trait Anxiety β (r) i. Using State Anxiety as the criterion obtain the following: R² for the model = _______ Variables Friend Social Support error associated with State Anxiety = _________ Trait Anxiety β (r) j. Using Depression as the criterion obtain the following: R² for the model = _______ Variables Trait Anxiety error associated with Depression = _________ Stress Friend Social Support β (r) 5. Compare the two models a. N = ___________ d = __________ b. Fit of full model = _________ Fit of reduced model = __________ Q = ______ W = ______ c. Conclusion: Does removing the paths reduce the fit of the path model? p = _______ Your Turn #1 use the data set talent_pathdata451.sav 2. Working with the following variables, construct a causal model of college performance (first year college gpa -the outcome variable) with no more than 4 predictive layers – Socio-economic status, locus of control, self concept, motivation, reading, writing, math, gender, high school program. Locus of control, self concept and SES were measured in high school, reading, writing & math were measured when applying to college, motivation and gender were measured during the beginning of the first year of college. Remember to pay attention to both the measured and the manifested “when” for each variable!! a. b. c. d. e. f. Draw the full model with all the arrows. Draw a hypothesized model – dropping those paths that you think are non contributing Compute the full model and draw it with all the path coefficients Compute the hypothesized mode and draw it with the hypothesized path coefficients Test the hypothesized model vs. the full model Compute the “trimmed” model (dropping all non-significant paths from the full model) and draw it with al the included path coefficients. g. Test the trimmed model vs. the full model. About the “Your Turn,” your Laboratory Project and the Conference You may use the same criterion/predictors you used last week, change some, or change all of them -- your choice. Remember, a “good story” isn’t just “a set of all significant” predictors. Rather, it is a combination of things that do and don’t correlate/have multivariate contributions, so we can tell an interesting story about how these variables relate to the criterion. Have a mix of “kinds of predictors” (demographics, etc.) Have a mix of significant and nonsignificant multivariate contributors (6-8 predictors is plenty!!!) You may try multiple criterion variables in any data set, but you must present below 3 analyses using data from at least 2 different data sets! 3. Construct a causal model with no more than 4 predictive layers. Remember to pay attention to both the measured and the manifested “when” for each variable!! h. i. j. k. l. m. Draw the full model with all the arrows. Draw a hypothesized model – dropping those paths that you think are non contributing Compute the full model and draw it with all the path coefficients Compute the hypothesized mode and draw it with the hypothesized path coefficients Test the hypothesized model vs. the full model Compute the “trimmed” model (dropping all non-significant paths from the full model) and draw it with al the included path coefficients. n. Test the trimmed model vs. the full model.
