Chapter 7 – Additional Receivables Disclosures DEERE
advertisement
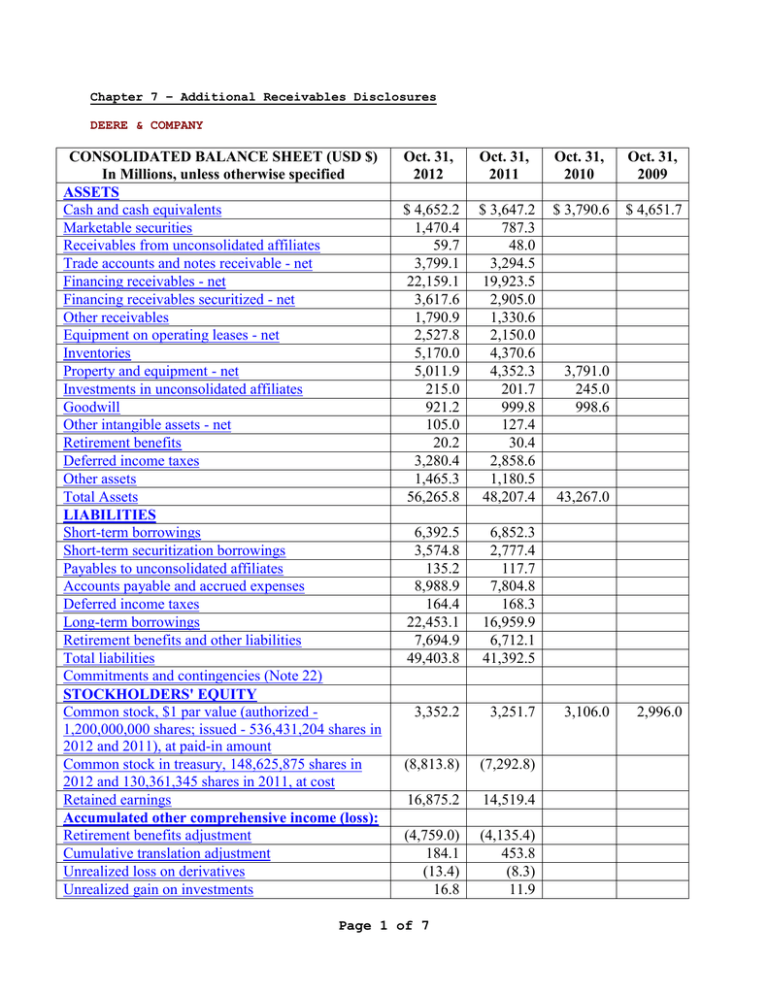
Chapter 7 – Additional Receivables Disclosures DEERE & COMPANY CONSOLIDATED BALANCE SHEET (USD $) In Millions, unless otherwise specified ASSETS Cash and cash equivalents Marketable securities Receivables from unconsolidated affiliates Trade accounts and notes receivable - net Financing receivables - net Financing receivables securitized - net Other receivables Equipment on operating leases - net Inventories Property and equipment - net Investments in unconsolidated affiliates Goodwill Other intangible assets - net Retirement benefits Deferred income taxes Other assets Total Assets LIABILITIES Short-term borrowings Short-term securitization borrowings Payables to unconsolidated affiliates Accounts payable and accrued expenses Deferred income taxes Long-term borrowings Retirement benefits and other liabilities Total liabilities Commitments and contingencies (Note 22) STOCKHOLDERS' EQUITY Common stock, $1 par value (authorized 1,200,000,000 shares; issued - 536,431,204 shares in 2012 and 2011), at paid-in amount Common stock in treasury, 148,625,875 shares in 2012 and 130,361,345 shares in 2011, at cost Retained earnings Accumulated other comprehensive income (loss): Retirement benefits adjustment Cumulative translation adjustment Unrealized loss on derivatives Unrealized gain on investments Oct. 31, 2012 Oct. 31, 2011 Oct. 31, 2010 Oct. 31, 2009 $ 4,652.2 1,470.4 59.7 3,799.1 22,159.1 3,617.6 1,790.9 2,527.8 5,170.0 5,011.9 215.0 921.2 105.0 20.2 3,280.4 1,465.3 56,265.8 $ 3,647.2 787.3 48.0 3,294.5 19,923.5 2,905.0 1,330.6 2,150.0 4,370.6 4,352.3 201.7 999.8 127.4 30.4 2,858.6 1,180.5 48,207.4 $ 3,790.6 $ 4,651.7 6,392.5 3,574.8 135.2 8,988.9 164.4 22,453.1 7,694.9 49,403.8 6,852.3 2,777.4 117.7 7,804.8 168.3 16,959.9 6,712.1 41,392.5 3,352.2 3,251.7 (8,813.8) (7,292.8) 16,875.2 14,519.4 (4,759.0) 184.1 (13.4) 16.8 (4,135.4) 453.8 (8.3) 11.9 Page 1 of 7 3,791.0 245.0 998.6 43,267.0 3,106.0 2,996.0 Accumulated other comprehensive income (loss) Total Deere & Company stockholders' equity Noncontrolling interests Total stockholders' equity Total Liabilities and Stockholders' Equity (4,571.5) 6,842.1 19.9 6,862.0 $ 56,265.8 (3,678.0) 6,800.3 14.6 6,814.9 $ 48,207.4 6,303.4 4,822.8 12. RECEIVABLES Trade Accounts and Notes Receivable Trade accounts and notes receivable at October 31 consisted of the following in millions of dollars: 2012 Trade accounts and notes: Agriculture and turf Construction and forestry Trade accounts and notes receivable—net $ $ 3,074 725 3,799 2011 $ $ 2,618 676 3,294 At October 31, 2012 and 2011, dealer notes included in the previous table were $95 million and $97 million, and the allowance for doubtful trade receivables was $66 million and $72 million, respectively. The equipment operations sell a significant portion of their trade receivables to financial services and provide compensation to these operations at approximate market rates of interest. Trade accounts and notes receivable primarily arise from sales of goods to independent dealers. Under the terms of the sales to dealers, interest is primarily charged to dealers on outstanding balances, from the earlier of the date when goods are sold to retail customers by the dealer or the expiration of certain interest-free periods granted at the time of the sale to the dealer, until payment is received by the company. Dealers cannot cancel purchases after the equipment is shipped and are responsible for payment even if the equipment is not sold to retail customers. The interest-free periods are determined based on the type of equipment sold and the time of year of the sale. These periods range from one to twelve months for most equipment. Interest-free periods may not be extended. Interest charged may not be forgiven and the past due interest rates exceed market rates. The company evaluates and assesses dealers on an ongoing basis as to their creditworthiness and generally retains a security interest in the goods associated with the trade receivables. The company is obligated to repurchase goods sold to a dealer upon cancellation or termination of the dealer’s contract for such causes as change in ownership and closeout of the business. Trade accounts and notes receivable have significant concentrations of credit risk in the agriculture and turf sector and construction and forestry sector as shown in the previous table. On a geographic basis, there is not a disproportionate concentration of credit risk in any area. Financing Receivables Financing receivables at October 31 consisted of the following in millions of dollars: 2012 Unrestricted/Securitized Retail notes: Equipment: Agriculture and turf Construction and forestry Recreational products Total Wholesale notes $ 14,144 1,091 15,235 3,888 Page 2 of 7 $ 3,126 553 3,679 2011 Unrestricted/Securitized $ 12,969 1,036 4 14,009 3,006 $ 2,597 362 2,959 Revolving charge accounts Financing leases (direct and sales-type) Operating loans Total financing receivables Less: Unearned finance income: Equipment notes Financing leases Total Allowance for credit losses Financing receivables — net 2,488 1,411 42 23,064 $ 2,518 1,242 84 20,859 3,679 619 126 745 160 22,159 44 44 17 3,618 $ 635 121 756 179 19,924 $ 2,959 36 36 18 2,905 $ The residual values for investments in financing leases at October 31, 2012 and 2011 totaled $79 million and $75 million, respectively. Financing receivables have significant concentrations of credit risk in the agriculture and turf sector and construction and forestry sector as shown in the previous table. On a geographic basis, there is not a disproportionate concentration of credit risk in any area. The company retains as collateral a security interest in the equipment associated with retail notes, wholesale notes and financing leases. Financing receivables at October 31 related to the company’s sales of equipment that were included in the table above consisted of the following in millions of dollars: 2012 Unrestricted Retail notes*: Equipment: Agriculture and turf Construction and forestry Total Wholesale notes Sales-type leases Total Less: Unearned finance income: Equipment notes Sales-type leases Total Financing receivables related to the company’s sales of equipment $ 1,810 313 2,123 3,888 836 6,847 191 61 252 6,595 $ 2011 Unrestricted $ 1,633 310 1,943 3,006 776 5,725 197 64 261 5,464 $ * These retail notes generally arise from sales of equipment by company-owned dealers or through direct sales. Financing receivable installments, including unearned finance income, at October 31 are scheduled as follows in millions of dollars: 2012 Unrestricted/Securitized Due in months: 0 - 12 13 - 24 25 - 36 37 - 48 49 - 60 Thereafter $ 11,486 4,257 3,232 2,278 1,356 455 Page 3 of 7 $ 1,437 1,004 712 399 120 7 2011 Unrestricted/Securitized $ 10,311 3,937 2,960 2,032 1,196 423 $ 1,192 807 524 305 119 12 $ Total 23,064 $ 3,679 $ 20,859 $ 2,959 The maximum terms for retail notes are generally seven years for agriculture and turf equipment and five years for construction and forestry equipment. The maximum term for financing leases is generally five years, while the average term for wholesale notes is less than twelve months. At October 31, 2012 and 2011, the unpaid balances of receivables administered but not owned were $120 million and $146 million, respectively. At October 31, 2012 and 2011, worldwide financing receivables administered, which include financing receivables administered but not owned, totaled $25,897 million and $22,974 million, respectively. Past due balances of financing receivables still accruing finance income represent the total balance held (principal plus accrued interest) with any payment amounts 30 days or more past the contractual payment due date. Non-performing financing receivables represent loans for which the company has ceased accruing finance income. These receivables are generally 120 days delinquent and the estimated uncollectible amount, after charging the dealer’s withholding account, has been written off to the allowance for credit losses. Finance income for nonperforming receivables is recognized on a cash basis. Accrual of finance income is resumed when the receivable becomes contractually current and collections are reasonably assured. An age analysis of past due and non-performing financing receivables at October 31, 2012 follows in millions of dollars: 30-59 Days Past Due Retail Notes: Agriculture and turf Construction and forestry Other: Agriculture and turf Construction and forestry Total $ $ 60-89 Days Past Due 60 39 21 8 128 $ $ $ 102 66 30 12 210 25 18 6 2 51 $ $ $ $ 117 13 11 3 144 17 9 3 2 31 $ Total NonPerforming Total Past Due Retail Notes: Agriculture and turf Construction and forestry Other: Agriculture and turf Construction and forestry Total 90 Days or Greater Past Due* Total Past Due $ $ $ 16,432 1,521 $ 6,464 1,183 25,600 Less allowance for credit losses Total financing receivables - net 30 12 210 Total Financing Receivables Current $ 102 66 16,651 1,600 6,505 1,198 25,954 $ 177 25,777 * Financing receivables that are 90 days or greater past due and still accruing finance income. An age analysis of past due and non-performing financing receivables at October 31, 2011 follows in millions of dollars: 30-59 Days Past Due Retail Notes: Page 4 of 7 60-89 Days Past Due 90 Days or Greater Past Due* Total Past Due Agriculture and turf Construction and forestry Other: Agriculture and turf Construction and forestry Total $ 81 45 23 7 156 $ $ $ 136 76 38 13 263 $ 10 4 64 $ $ $ $ 132 17 16 5 170 25 11 5 2 43 $ Total NonPerforming Total Past Due Retail Notes: Agriculture and turf Construction and forestry Recreational products Other: Agriculture and turf Construction and forestry Total 30 20 $ 38 13 263 $ Current $ 136 76 Total Financing Receivables 14,667 1,264 4 $ 5,655 1,003 22,593 Less allowance for credit losses Total financing receivables - net * $ 14,935 1,357 4 5,709 1,021 23,026 $ 197 22,829 Financing receivables that are 90 days or greater past due and still accruing finance income. An analysis of the allowance for credit losses and investment in financing receivables follows in millions of dollars: Revolving Charge Accounts Retail Notes 2012 Allowance: Beginning of year balance Provision (credit) Write-offs Recoveries Translation adjustments End of year balance Balance individually evaluated* Financing receivables: End of year balance Balance individually evaluated* * $ $ $ $ 130 $ (12) (8) 10 (10) 110 $ $ 18,251 11 $ $ Other 40 $ 8 (30) 22 Total 27 $ 3 (4) 1 40 1 $ 27 $ $ 2,488 1 $ $ 5,215 1 $ $ 197 (1) (42) 33 (10) 177 1 25,954 13 Remainder is collectively evaluated. 2011 Allowance: Beginning of year balance Provision (credit) Write-offs Recoveries End of year balance Balance individually evaluated* $ $ $ 144 $ 3 (29) 12 130 $ 1 Page 5 of 7 44 $ 8 (40) 28 40 $ 37 $ (2) (10) 2 27 $ $ 225 9 (79) 42 197 1 Financing receivables: End of year balance Balance individually evaluated* $ $ 16,296 12 $ 2,518 $ $ 4,212 11 $ $ 23,026 23 * Remainder is collectively evaluated. A comparative analysis of the allowance for credit losses follows in millions of dollars: 2012 $ Beginning of year balance Provision (credit) Write-offs Recoveries Translation adjustments End of year balance $ 2011 197 $ (1) (42) 33 (10) 177 $ 2010 225 $ 9 (79) 42 197 $ 239 100 (147) 31 2 225 Past-due amounts over 30 days represented .81 percent and 1.14 percent of the receivables financed at October 31, 2012 and 2011, respectively. The allowance for credit losses represented .68 percent and .86 percent of financing receivables outstanding at October 31, 2012 and 2011, respectively. In addition, at October 31, 2012 and 2011, the company’s financial services operations had $194 million and $188 million, respectively, of deposits withheld from dealers and merchants available for potential credit losses. Financing receivables are considered impaired when it is probable the company will be unable to collect all amounts due according to the contractual terms. Receivables reviewed for impairment generally include those that are either past due, or have provided bankruptcy notification, or require significant collection efforts. Receivables that are impaired are generally classified as non-performing. An analysis of the impaired financing receivables at October 31 follows in millions of dollars: Unpaid Principal Balance Recorded Investment 2012 Receivables with specific allowance* Receivables without a specific allowance** Total Agriculture and turf Construction and forestry 2011 Receivables with specific allowance* Receivables without a specific allowance** Total Agriculture and turf Construction and forestry $ $ $ $ $ $ $ $ 1 9 10 6 4 $ 7 9 16 11 5 $ $ $ $ $ $ $ Average Recorded Investment Specific Allowance 1 9 10 6 4 $ 1 $ $ $ 1 1 $ $ $ 7 9 16 11 5 $ 1 $ $ $ 1 1 $ $ $ 1 10 11 6 5 8 12 20 14 6 * Finance income recognized was not material. ** Primarily retail notes. A troubled debt restructuring is generally the modification of debt in which a creditor grants a concession it would not otherwise consider to a debtor that is experiencing financial difficulties. These modifications may include a reduction of the stated interest rate, an extension of the maturity dates, a reduction of the face amount or maturity Page 6 of 7 amount of the debt, or a reduction of accrued interest. During 2012 and 2011, the company identified 138 and 213 financing receivable contracts, primarily retail notes, as troubled debt restructurings with aggregate balances of $5 million and $11 million pre-modification and $4 million and $10 million post-modification, respectively. During these same periods, there were no significant troubled debt restructurings that subsequently defaulted and were written off. At October 31, 2012, the company had no commitments to lend additional funds to borrowers whose accounts were modified in troubled debt restructurings. Other Receivables Other receivables at October 31 consisted of the following in millions of dollars: 2012 Taxes receivable Reinsurance receivables Insurance premium receivables Other Other receivables $ $ 971 569 69 182 1,791 2011 $ $ Reinsurance and insurance premium receivables are associated with the financial services’ crop insurance subsidiary (see Note 9). Page 7 of 7 844 242 58 187 1,331
