AP STATISTICS: Ms Jetmore 2015
advertisement

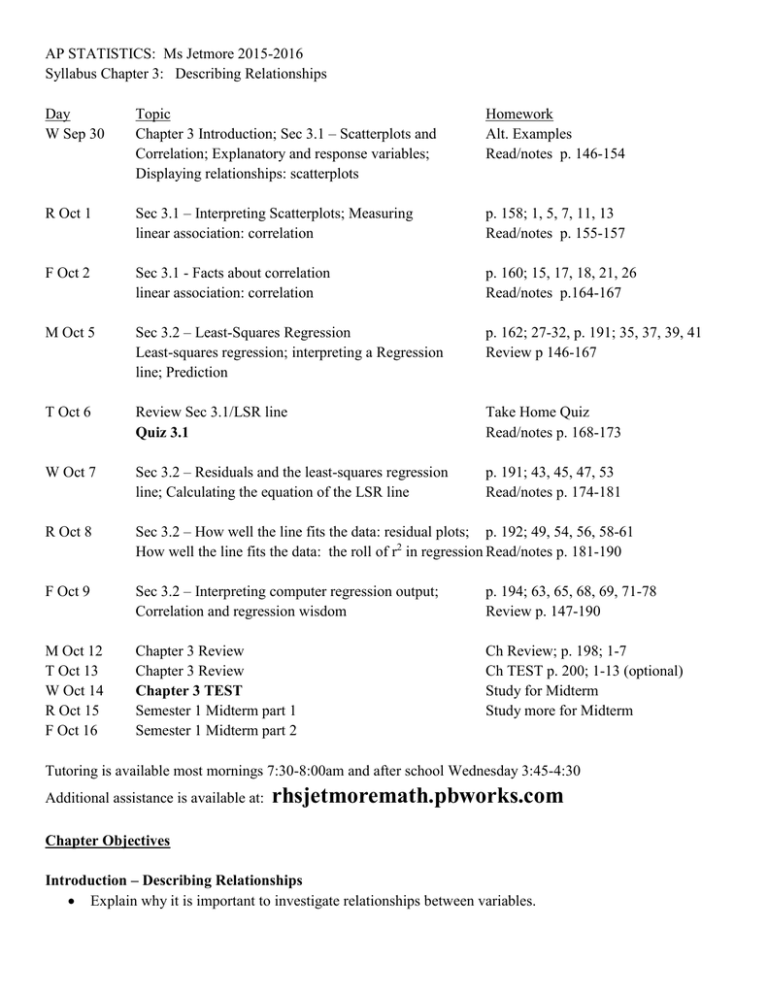
AP STATISTICS: Ms Jetmore 2015-2016 Syllabus Chapter 3: Describing Relationships Day W Sep 30 Topic Chapter 3 Introduction; Sec 3.1 – Scatterplots and Correlation; Explanatory and response variables; Displaying relationships: scatterplots Homework Alt. Examples Read/notes p. 146-154 R Oct 1 Sec 3.1 – Interpreting Scatterplots; Measuring linear association: correlation p. 158; 1, 5, 7, 11, 13 Read/notes p. 155-157 F Oct 2 Sec 3.1 - Facts about correlation linear association: correlation p. 160; 15, 17, 18, 21, 26 Read/notes p.164-167 M Oct 5 Sec 3.2 – Least-Squares Regression Least-squares regression; interpreting a Regression line; Prediction p. 162; 27-32, p. 191; 35, 37, 39, 41 Review p 146-167 T Oct 6 Review Sec 3.1/LSR line Quiz 3.1 Take Home Quiz Read/notes p. 168-173 W Oct 7 Sec 3.2 – Residuals and the least-squares regression line; Calculating the equation of the LSR line p. 191; 43, 45, 47, 53 Read/notes p. 174-181 R Oct 8 Sec 3.2 – How well the line fits the data: residual plots; p. 192; 49, 54, 56, 58-61 How well the line fits the data: the roll of r2 in regression Read/notes p. 181-190 F Oct 9 Sec 3.2 – Interpreting computer regression output; Correlation and regression wisdom p. 194; 63, 65, 68, 69, 71-78 Review p. 147-190 M Oct 12 T Oct 13 W Oct 14 R Oct 15 F Oct 16 Chapter 3 Review Chapter 3 Review Chapter 3 TEST Semester 1 Midterm part 1 Semester 1 Midterm part 2 Ch Review; p. 198; 1-7 Ch TEST p. 200; 1-13 (optional) Study for Midterm Study more for Midterm Tutoring is available most mornings 7:30-8:00am and after school Wednesday 3:45-4:30 Additional assistance is available at: rhsjetmoremath.pbworks.com Chapter Objectives Introduction – Describing Relationships Explain why it is important to investigate relationships between variables. Section 3.1 – Scatterplots and Correlation Identify explanatory and response variables in situations where one variable helps explain or influences the other. Make a scatterplot to display the relationship between two quantitative variables. Describe the direction, form, and strength of the overall pattern of a scatterplot. Recognize outliers in a scatterplot. Know the basic properties of correlation. Calculate and interpret correlation. Explain how the correlation r is influenced by extreme observations. Section 3.2 – Least-Squares Regression Interpret the slope and y intercept of a least-squares regression line. Use the least-squares regression line to predict y for a given x. Explain the dangers of extrapolation. Calculate and interpret residuals. Explain the concept of least squares. Use technology to find a least-squares regression line. Find the slope and intercept of a least-squares regression line from the means and standard deviations of x and y and their correlation. Construct and interpret residual plots to assess if a linear model is appropriate. Use the standard deviation of the residuals s to assess how well the line fits the data. Use r 2 to assess how well the line fits the data. Identify the equation of a least-squares regression line from computer output. Explain why association doesn’t imply causation. Recognize how the slope, y intercept, standard deviation of the residuals, and r 2 are influenced by extreme observations. AP Exam Tips If you are asked to make a scatterplot on a free-response question, be sure to label and scale both axes. Don’t copy an unlabeled calculator graph directly onto your paper. There’s no firm rule for how many decimal places to show for answers on the AP exam. Our advice: Give your answer correct to two or three nonzero decimal places. Exception: If you’re using one of the tables in the back of the book, give the value shown in the table. The formula sheet for the AP exam uses different notation for these equations: s b1 r y and b0 y b1 x . That’s because the least-squares line is written as ŷ b0 b1 x . We prefer our sx simpler version without the subscripts! Students often have a hard time interpreting the value of r 2 on AP exam questions. They frequently leave out key words in the definition. Our advice: Treat this as a fill-in-the-blank exercise. Write “ _____% of the variation in (response variable name) is accounted for by the regression line.” Free-Response Questions from Previous AP Exams Questions can be found on the AP Central Web site: http://apcentral.collegeboard.com/apc/members/exam/exam_questions/8357.html. Students should be able to answer all the free-response questions listed with material in this chapter. Questions that contain content from this chapter but also require content from later chapters are listed in the last chapter required to complete the entire question. Some of these problems we will do in class as warm-up problems. You may do the others to help you understand the content from this chapter as well as to prepare for the AP exam in May. Year 2012 Question 1 2007B 4 2005 3 2003B 2002 1 4 2002B 1 2000 1999 1 1 1998 2 1998 4 Content Describing a scatterplot with non-linear association, influential points, determining which points meet a consumer’s criterion. Graphing a least-squares regression line, calculating a residual, influential Points. Assessing linearity with residual plots, understanding and interpreting slope, interpreting r 2 , extrapolation. Influential points. Using regression output to state the equation of a least-squares regression line, finding and interpreting the correlation from computer output, clusters and influential points. Making a scatterplot, interpreting correlation, assessing linearity, interpreting r2 . Describing scatterplots. Using a residual plot to assess linearity, identify slope and y-intercept from computer output, interpreting slope and y-intercept, making a prediction using a least-squares regression line, using residuals to estimate actual values. Making a histogram of one variable from a scatterplot, describing a histogram, describing a scatterplot. Using regression output to state the equation of a least-squares regression line, analyzing patterns in a residual plot (Note: the residual plot uses predicted values on the horizontal axis instead of the values of the explanatory variable).


