Lab 5-Spectrophotometric Analysis of Sports Drinks
advertisement
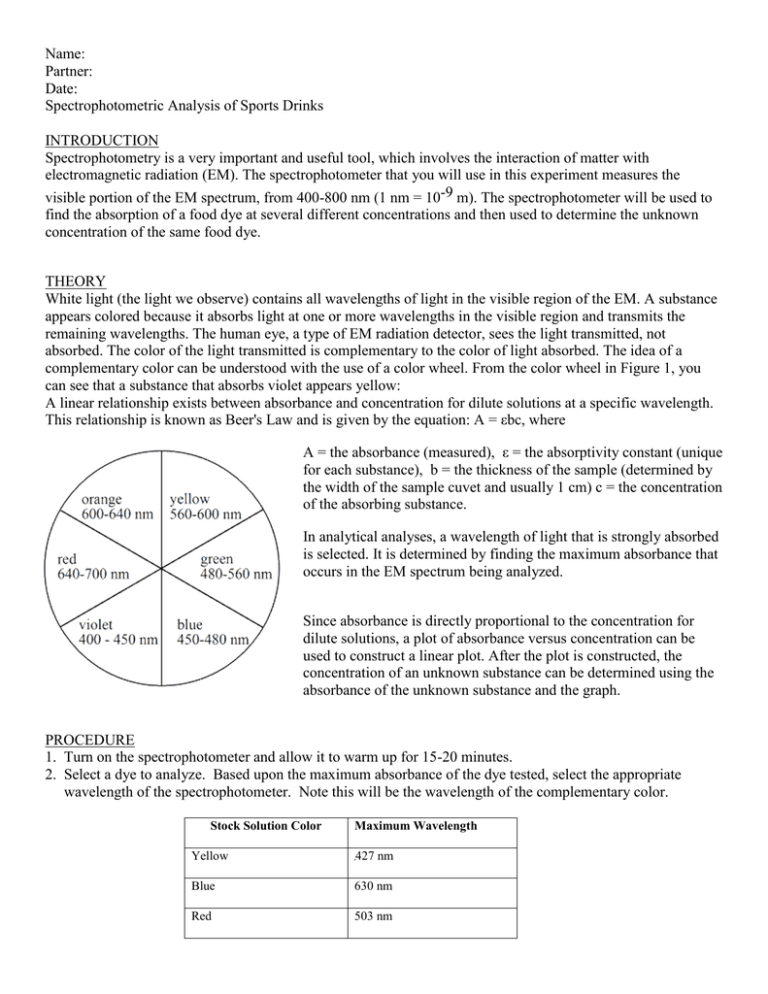
Name: Partner: Date: Spectrophotometric Analysis of Sports Drinks INTRODUCTION Spectrophotometry is a very important and useful tool, which involves the interaction of matter with electromagnetic radiation (EM). The spectrophotometer that you will use in this experiment measures the visible portion of the EM spectrum, from 400-800 nm (1 nm = 10-9 m). The spectrophotometer will be used to find the absorption of a food dye at several different concentrations and then used to determine the unknown concentration of the same food dye. THEORY White light (the light we observe) contains all wavelengths of light in the visible region of the EM. A substance appears colored because it absorbs light at one or more wavelengths in the visible region and transmits the remaining wavelengths. The human eye, a type of EM radiation detector, sees the light transmitted, not absorbed. The color of the light transmitted is complementary to the color of light absorbed. The idea of a complementary color can be understood with the use of a color wheel. From the color wheel in Figure 1, you can see that a substance that absorbs violet appears yellow: A linear relationship exists between absorbance and concentration for dilute solutions at a specific wavelength. This relationship is known as Beer's Law and is given by the equation: A = εbc, where A = the absorbance (measured), ε = the absorptivity constant (unique for each substance), b = the thickness of the sample (determined by the width of the sample cuvet and usually 1 cm) c = the concentration of the absorbing substance. In analytical analyses, a wavelength of light that is strongly absorbed is selected. It is determined by finding the maximum absorbance that occurs in the EM spectrum being analyzed. Since absorbance is directly proportional to the concentration for dilute solutions, a plot of absorbance versus concentration can be used to construct a linear plot. After the plot is constructed, the concentration of an unknown substance can be determined using the absorbance of the unknown substance and the graph. PROCEDURE 1. Turn on the spectrophotometer and allow it to warm up for 15-20 minutes. 2. Select a dye to analyze. Based upon the maximum absorbance of the dye tested, select the appropriate wavelength of the spectrophotometer. Note this will be the wavelength of the complementary color. Stock Solution Color Maximum Wavelength Yellow 427 nm Blue 630 nm Red 503 nm 3. Obtain approximately 50mL of stock solution containing the dye chosen by your lab group. 4. Using a serological pipet for accurate volume measurements, dilute the stock solution as indicated in the following table to prepare 10 mL each of a series of standard solutions, B-H. Hint: To avoid contaminating the stock solution, first use the pipet to add the required amount of distilled water to each test tube. Then, rinse the pipet three times with stock solution, and then measure and add the required amount of stock solution to each test tube. Solution Water (mL) Stock Solution (mL) Stock (A) 0 10 B 2 8 C 4 6 D 6 4 E F 7 3 8 2 G 9 1 Blank (H) 10 0 5. Prepare the spectrophotometer by setting the initial zero and then blanking it with distilled water (H) to adjust the transmittance to 100%. Before placing the test tube in the spectrophotometer, wipe off any finger prints using a Kim wipe. Be sure to pay attention to the placement of the test tube. Take your time with this process as this will be the calibration you use for the whole procedure. 6. Measure and record the percent transmittance (%T) and absorbance of the stock solution. Again, before placing the test tube in the spectrophotometer, wipe off any finger prints using a Kim wipe. Be sure to pay attention to the placement of the test tube. Repeat the measurement several times to ensure precision of the spectrophotometer. 7. Repeat this process with each prepared diluted standard solution, B-H. Before adding, mix each solution with a disposable pipet by squirting the solution in and out. 8. If you did not record absorbance, convert % T to transmittance, T, for each measurement and calculate the absorbance, –log T. Record all results. 9. Determine the concentrations of the resulting solutions—using the relative percentages of the diluted solutions. For example solution B will have a concentration that is 80% of solution A. Report the concentrations as micromolar. Dye Yellow Blue Red Stock Solution Concentration 27.8 µM 7.03 µM 38.6 µM Path Length 1cm 1cm 1cm 10. Prepare a graph of Absorbance (on the y axis) versus Dye Concentration (on the x-axis) for your solution. 11. This calibration curve should produce the relationship of a linear equation: y = mx + b where A =εb[c] + 0. The slope should be the molar absorptivity. 12. If a linear relationship is not obtained, repeat steps 3-9, perhaps with a different spectrophotometer. 13. Take a sample of the corresponding Gatorade solution and measure its absorbance. Note that Beer’s Law does not apply to measurements greater than 1.5 A. If this is measured, the sample should be diluted, and a new absorbance reading collected. 14. Using the calibration graph you created, determine the concentration of food dye in a corresponding sports drink. You may either use slope to plug into Beer’s Law formula or use the graph to determine the corresponding concentration to the measured absorbance of the Gatorade. 15. If time, repeat the procedure with a different dye. DATA Spectroscopic Data for Food Dye:_______________ Solution Dilution Ratio (mL stock/mL water) Concentration (𝝁𝑴) %T Transmittance Absorbance (-log T) Stock (A) B C D E F G Blank (H) Sports Drink POST LAB QUESTIONS 1. Based upon your determined concentration, calculate the amount (milligrams) of dye in 1-L of your selected sports drink. Dye Molar Mass FD&C Yellow 5 534 g/mol FD&C Blue 1 793 g/mol FD&C Red 40 496 g/mol 2. Based upon the known molar absorptivity values for the dyes, determine your percent error in determining the concentration of dye in your sports drink. Provide some explanation for your error. Dye Molar Absorptivity Coefficient FD&C Yellow 5 27,300 M-1cm-1 FD&C Blue 1 130,000 M-1cm-1 FD&C Red 40 25, 900 M-1cm-1 3. Calculate the %T for an absorbance value A = 1.5. Using this result, explain why absorbance measurements >1 may not be accurate. 4. Spectrophotometric studies can be conducted on any colored compound. The transition metal group of the periodic table exhibits a wide array of different colored compounds. The complex ion, tetraaminecopper(II), [Cu(NH3)4]2+, contains four ammonia molecules covalently bonded to a copper (II) ion. In aqueous solutions, Cu2+ ions will bond to four water molecules in a square planar geometry. The ion is a light blue color. The water molecules can be displaced by ammonia molecules, which are stronger Lewis bases than water. The appearance of the intense dark blue-violet color of [Cu(NH3)4]2+ ion is often used as a positive test to verify the presence of Cu2+ ions. A. Write a balanced chemical equation for the reaction of copper (II) sulfate and concentrated ammonia to produce tetraaminecopper(II) sulfate. B. How could you use spectrophotometry to confirm that this reaction has occurred and that the product formed is in fact tetraaminecopper(II) sulfate? Would you expect the wavelength of maximum absorbance for [Cu(NH3)4]2+ to be greater than or less than the wavelength for maximum absorbance of [Cu(H2O)6]2+? C. The electron transitions responsible for the colors of transition metal ions involve d d transitions. Why are zinc ions than colorless in aqueous solutions?

