Background - Liberty Union High School District
advertisement
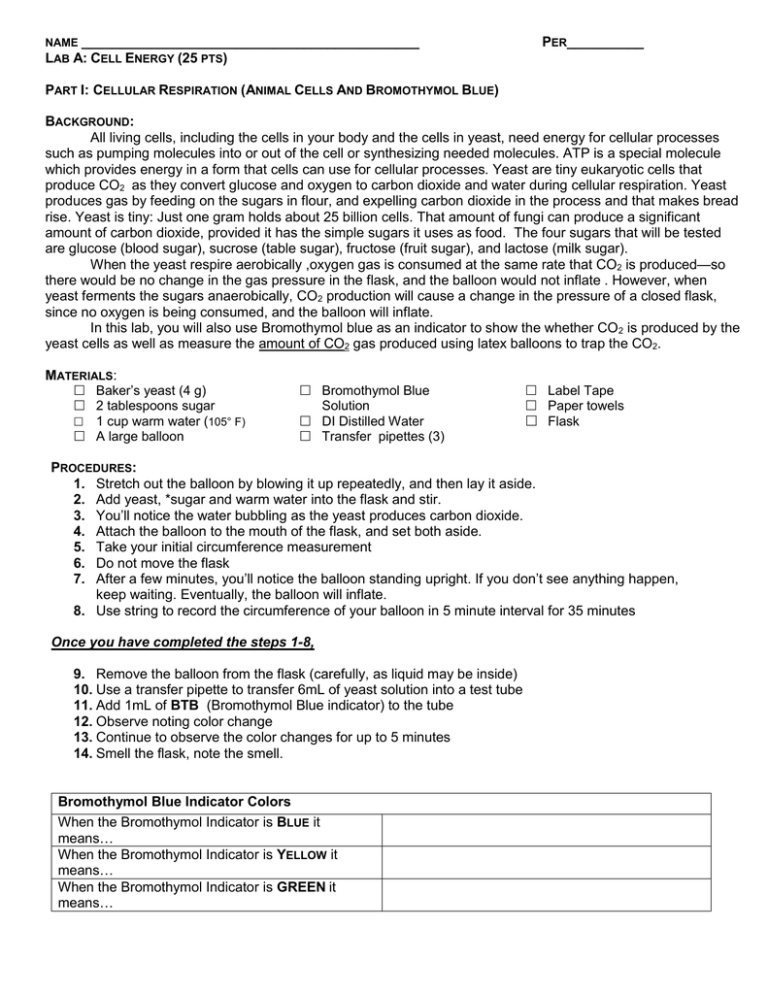
NAME ____________________________________________ LAB A: CELL ENERGY (25 PTS) PER__________ PART I: CELLULAR RESPIRATION (ANIMAL CELLS AND BROMOTHYMOL BLUE) BACKGROUND: All living cells, including the cells in your body and the cells in yeast, need energy for cellular processes such as pumping molecules into or out of the cell or synthesizing needed molecules. ATP is a special molecule which provides energy in a form that cells can use for cellular processes. Yeast are tiny eukaryotic cells that produce CO2 as they convert glucose and oxygen to carbon dioxide and water during cellular respiration. Yeast produces gas by feeding on the sugars in flour, and expelling carbon dioxide in the process and that makes bread rise. Yeast is tiny: Just one gram holds about 25 billion cells. That amount of fungi can produce a significant amount of carbon dioxide, provided it has the simple sugars it uses as food. The four sugars that will be tested are glucose (blood sugar), sucrose (table sugar), fructose (fruit sugar), and lactose (milk sugar). When the yeast respire aerobically ,oxygen gas is consumed at the same rate that CO2 is produced—so there would be no change in the gas pressure in the flask, and the balloon would not inflate . However, when yeast ferments the sugars anaerobically, CO2 production will cause a change in the pressure of a closed flask, since no oxygen is being consumed, and the balloon will inflate. In this lab, you will also use Bromothymol blue as an indicator to show the whether CO2 is produced by the yeast cells as well as measure the amount of CO2 gas produced using latex balloons to trap the CO2. MATERIALS: Baker’s yeast (4 g) 2 tablespoons sugar 1 cup warm water (105° F) A large balloon Bromothymol Blue Solution DI Distilled Water Transfer pipettes (3) Label Tape Paper towels Flask PROCEDURES: 1. Stretch out the balloon by blowing it up repeatedly, and then lay it aside. 2. Add yeast, *sugar and warm water into the flask and stir. 3. You’ll notice the water bubbling as the yeast produces carbon dioxide. 4. Attach the balloon to the mouth of the flask, and set both aside. 5. Take your initial circumference measurement 6. Do not move the flask 7. After a few minutes, you’ll notice the balloon standing upright. If you don’t see anything happen, keep waiting. Eventually, the balloon will inflate. 8. Use string to record the circumference of your balloon in 5 minute interval for 35 minutes Once you have completed the steps 1-8, 9. Remove the balloon from the flask (carefully, as liquid may be inside) 10. Use a transfer pipette to transfer 6mL of yeast solution into a test tube 11. Add 1mL of BTB (Bromothymol Blue indicator) to the tube 12. Observe noting color change 13. Continue to observe the color changes for up to 5 minutes 14. Smell the flask, note the smell. Bromothymol Blue Indicator Colors When the Bromothymol Indicator is BLUE it means… When the Bromothymol Indicator is YELLOW it means… When the Bromothymol Indicator is GREEN it means… Name _________________________________________ Period _______ LAB A: CELL ENERGY (25 PTS) …WITH DATA PART 1: CELLULAR RESPIRATION ANALYSIS PURPOSE: _____________________________________________________________________________ EQUATION: ____________________________________________________________________________ Data Table 1: Growth of Balloon Time (min) Circumference (cm) 0 5 10 15 Time (min) 20 25 30 35 Circumference (cm) 1. Graph: construct a graph showing the change in circumference over time. ***remember your TAILS!!!*** a. Attach the graph paper to this lab and use the data to answer the analysis questions 2. What is the independent variable? ___________________________________________________________________________________ 3. What is the dependent variable? ___________________________________________________________________________________ 4. What is the purpose of the indicator Bromothymol blue? ___________________________________________________________________________________ 5. List at least 3 things you know about yeast from previous labs? _______________________________________________________________________________________ _______________________________________________________________________________________ 6. What does the color change of the tube containing yeast represent? _______________________________________________________________________________________ 7. How do you know if the yeast produced CO2 and not some other gas that blew up the balloon? _______________________________________________________________________________________ _______________________________________________________________________________________ _______________________________________________________________________________________ 8. What test did you do to verify it was CO2? ___________________________________________________________________________________ 9. What are the two types of Cellular Respiration ___________________________________________________________________________________ 10. Which type of cellular respiration one took place in this lab? ___________________________________________________________________________________ 11. How do you know? ___________________________________________________________________________________ 12. Describe the relationship between CO2 levels and pH levels _______________________________________________________________________________________ _______________________________________________________________________________ 13. Do ALL CELLS GO through cellular respiration? _______________ PART II: CELLULAR ENERGY (DEMONSTRATION) PROBLEM To demonstrate this we will determine whether CO2 is consumed or produced as Elodea is placed in light or dark BACKGROUND It is well known that in the presence of light plants perform photosynthesis. It is less understood that at the same time plants are also performing cell respiration. A change in CO2 levels due to photosynthesis and cellular respiration will be detected by the pH indicator bromothymol blue. Bromothymol blue (BTB) indicates the pH of solutions by its change in color. Bromothymol blue is yellow under acidic conditions (high H ion concentration), blue under basic conditions (low H ion concentration) and green under neutral conditions. A change in CO2 will cause a directly change in H ion. If the CO2 concentration decreases, the H ion concentration will also decrease and the solution will change to blue, becoming basic. If the CO2 concentration increases, the H ion concentration will also increase and the solution will change to yellow, becoming acidic. In this lab we will work with Elodea, a common aquarium plant that has also escaped into some local waterways such as the Delta. Elodea is an excellent plant for our studies of photosynthesis and cells because it is easy to grow, and readily available. The leaves are only a few cells thick so they will be easy for us to observe under the microscope to look at cells and cell parts. MATERIALS: Elodea (10cm) BTB: Bromothymol Blue DI Distilled Water Straws Metric Ruler Transfer pipettes (3) Clamp Lamp Beakers (4) Test Tubes (4) Test Tube Rack (Large) Aluminum Foil Reagents Sheet PROCEDURES: 1. Combine 7mL of distilled water with 1mL of BTB solution and GENTLY bubble one lungful of air through the straw. The liquid should turn a greenish color. 2. Label four test tubes: "Control," "1.25 cm Elodea" and "4 cm Elodea." And "4 cm dark" The test tube marked "control" will be sealed with masking tape and no plant will be added. 3. The test tube marked "Control" is sealed with masking tape. To the other test tubes, add the designated length of elodea, gently pushing each down into the solution with the straw. 4. Place test tubes in rack and place rack near the clamp lamp or in direct sunlight. 5. Wrap the "4 cm dark" test tube in aluminum foil, so that no light gets in. 6. View the colors of the test tubes after a half hour (or even overnight). PART II: CELLULAR ENERGY (DEMONSTRATION) ANALYSIS PURPOSE:________________________________________________________________________________ RESULTS: Record your results in the table below. Table 1: Results of photosynthesis Sample Control 1.25 cm Elodea 4 cm Elodea 4 cm dark Color pH range 1. 2. 3. 4. Give at least one reason why do we use Elodea in this lab ________________________________________ What is the independent variable? ___________________________________________________________ What is the dependent variable? ____________________________________________________________ What is the purpose of the indicator Bromothymol blue? ______________________________________________________________________________________ 5. EQUATION: Write out the equation for photosynthesis ______________________________________________________________________________________ 6. Look at the Elodea in the light, what do you notice about the leaves? ______________________________________________________________________________________ 7. What are the bubbles? (Hint: look at the equation) ______________________________________________ 8. Did the plants change the level of CO2 in the test tubes? _________________________________________ a. How do you know the pH changed? ___________________________________________________ 9. Was there a difference between the size of the plant and the change in C02 level? __________________________________________________________________________________________ __________________________________________________________________________________________ 10. Why did you initially blow into the solution to turn it yellow/green? ______________________________________________________________________________________ 11. What is the purpose of the control? ______________________________________________________________________________________ 12. Compare the 4cm dark to the 4cm in the light test tube. How do you account for any differences in color? ______________________________________________________________________________________
