投影片 1
advertisement
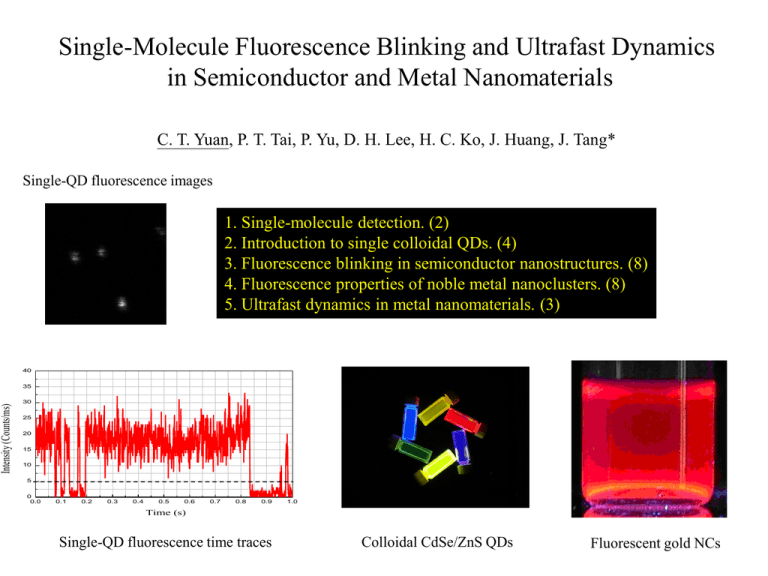
Single-Molecule Fluorescence Blinking and Ultrafast Dynamics in Semiconductor and Metal Nanomaterials C. T. Yuan, P. T. Tai, P. Yu, D. H. Lee, H. C. Ko, J. Huang, J. Tang* Single-QD fluorescence images 1. Single-molecule detection. (2) 2. Introduction to single colloidal QDs. (4) 3. Fluorescence blinking in semiconductor nanostructures. (8) 4. Fluorescence properties of noble metal nanoclusters. (8) 5. Ultrafast dynamics in metal nanomaterials. (3) 40 Intensity (Counts/ms) 35 30 25 20 15 10 5 0 0.0 0.1 0.2 0.3 0.4 0.5 0.6 0.7 0.8 0.9 1.0 Time (s) Single-QD fluorescence time traces Colloidal CdSe/ZnS QDs Fluorescent gold NCs Why Single-Molecule Detection? Ensemble measurements Laser volume~10-6 L Sample concentration~10-6 Molar Total measured particles~1011 Single-Molecule Detection Only one target is probed at a time Why Single-Molecule Detection in Nanomaterials? Sample Heterogeneity (size, shape, local surface) Time-dependent dynamical fluctuation (intensity, lifetime) Time Phys. Rev. Lett. 88, 077402 (2002) Potential applications based on SMD Protein folding/unfolding dynamics • Fluorescent labels for SMD • Nontoxic • Small • Biocompatible Roger Tsien, Nobel Prize in Chemistry in 2008 Green fluorescent protein Colloidal Semiconductor CdSe QDs Colloidal semiconductor QDs Glove box Excellent fluorescence properties 1. Photostability 2. Broad absorption band 3. Narrow emission band 4. Emission tunability 5. Bio-compatibility Photo-stability and multi-colors labeling 3T3 cells Nature materials 4, 435, 2005 QDs AlexaFluor 488 Human epithelial cells Nature biotechnology 22, 969, 2004 Fluorescence blinking in single CdSe QDs Binning-threshold methods P At 40 On-time log P log At log P log A log t 30 25 20 log Pvs. log t Off-time 15 10 5 0 0.0 0.1 0.2 0.3 0.4 0.5 0.6 0.7 0.8 0.9 1.0 1 Time (s) • Single molecules, polymers, Si, PbSe, CdTe NCs…… • On the timescales of ms to minutes. • Power-law distribution for on/off-times. • Power-law exponent, 1.1~2. • Modified by surface and environments Normalized events Intensity (Counts/ms) 35 0.1 0.01 100 1000 10000 On time (ms) On states, neutral QDs Off states, charged QDs • How the electron is rejected and returned from QDs and traps • Power-law distributions • Timescales (ms~min) Surface, substrates Auger Processes • Long-range Coulomb interactions. • Efficient in 0D QDs due to lack of momentum conservation. • Time-scales of ~ps, depending on size, shape. Auger rad Fluorescence blinking dark states Complication for achieving the lasing regime 40 Intensity (Counts/ms) 35 30 25 20 15 10 5 0 0.0 0.1 0.2 0.3 0.4 0.5 0.6 Time (s) 0.7 0.8 0.9 1.0 Nature Physics, 4, 519 (2008) Diffusion Controlled Electron Transfer (DCET) models P(t ) ~ t tc /2 P(t ) ~ t tc 2 / 2 dark state (charged QDs) if t tc exp ( Γt ) if t tc , Future work Present work Previous work Bright state (neutral QDs) Auger process Photon emission Tang and Marcus, Phys. Rev. Lett. 95, 107401 (2005) Power-law behavior with extended time ranges by autocorrelation function analysis Disadvantages for conventional binning-threshold methods -Time resolution is limited by bin sizes (~10 ms). -Bin size is limited by SN ratio. -Pre-defined threshold is affected by human subjectivity. The main purpose is to find out the relationship between P(t) and G(t) G ( ) I (t ) I (t ) I (t ) 2 Laplace transformation 1 1 G ( s) 1 s s 1 g1 ( s) g 2 ( s) , F(t)=G(t)/G(0)-1 F ( s) 1 , s 2 1 g 1 ( s) g 2 ( s) F (t ) ~ t tc 2 if t tc F (t ) ~ t tc / 2 if t t c . Relationship between power-law blinking statistics P(t) and autocorrelation functions G(t) • No requirements of selecting bin times and threshold. • Microsecond time resolution can be achieved. m 2 2 2 0.37, m 1.63 Interaction between single QDs and Ag NPs 100 nm Normalized absorption (a.u.) Spherical particles • Energy transfer. • Plasmonic effects. Triangular prism 1.0 0.5 0.0 300 400 500 600 700 Wavelength (nm) 800 900 1000 Fluorescence Lifetime Correlation Spectroscopy (FLCS) 3D diffusion G ( ) r 2 1 (1 ) 1 (1 20 ) 1/ 2 N d z 0 d 3D diffusion triplet state blinking G ( ) r 2 1 T (1 ) 1 (1 20 ) 1/ 2 [1 exp( )] N d z 0 d 1 T t 3D diffusion QDs blinking G ( ) r 2 1 T (1 ) 1 (1 20 ) 1/ 2 [1 exp( ) ] N d z 0 d 1 T t 8 CdSe/ZnS QDs QDs+triangular Ag NPs 7 G() (QYs ) QDs Ag 5 4 3 N Ag N QDs F F 6 150 ~4 CdSe/ZnS QDs QDs+triangular Ag NPs ~ 2 .8 QDs for former-half part QDs for later-half part 7 100 G() (QYs ) QDs Counts/10 ms 6 8 5 4 3 2 50 1 QDs 0 ~ 11 620 640 660 680 700 720 740 760 0 1E-3 780 0.01 0.1 1 10 100 1000 Observation time (s) QDs Ag Lag time (ms) 8 2 QDs+Ag for former-half part QDs+Ag for later-half part 7 6 0 1E-3 G() 1 5 4 3 0.01 0.1 1 10 100 1000 Lag time (ms) • Fluorescence quenching for individual QDs (uniform quenching). • Improvement of photo-stability. 2 1 0 1E-3 0.01 0.1 1 Lag time (s) 10 100 1000 Fluorescence decay profiles Brightness per QDs (FCS) Normalized intensity (a.u.) 1 kr F k r fl k r k nr QDs QDs coupled triangular Ag FQDs FQDs Ag 0.1 FQDs FQDs Ag 0.01 0 10 20 Decay time (ns) 30 Measured lifetimes (TCSPC) 40 kQDs QDs kQDs Ag QDs Ag ~ 11, QDs QDs Ag ~ 10 kQDs ~ kQDs Ag • No significant effect on radiative decay rates. • Enhancing nonradiative decay rates. Fluorescence Time Traces and Intensity Distribution for Immobilized QDs CdSe/ZnS QDs CdSe/ZnS QDs+triangular Ag NPs 200 Counts/ 10 ms Counts/10 ms 200 150 100 150 100 50 50 0 0 5 10 15 20 Observation time (s) 25 30 0.0 0.2 0.4 0.6 Normalized events 0.8 1.0 Fluorescence lifetime CdSe/ZnS QDs CdSe/ZnS QDs+triangular Ag NPs 0.1 1.0 Normalized events Normalized intensity (a.u.) 1 0.01 0.8 0.6 0.4 0.2 1E-3 0 50 100 Decay time (ns) 150 0.0 5 10 15 Lifetime (ns) 20 25 Nontoxic, Water-soluble, Tiny, Fluorescent Gold Nanoclusters Three regimes for gold NPs Nanoparticle (scattering light) bulk Nanocluster (fluorescence) R<2 nm, electron Fermi-wavelength R>>λ R~50 nm, electron mean free path Why fluorescent gold nanoclusters? • CdSe QDs, toxic precursor • Gold NPs, scattering signal is too weak for <10 nm particles Absorption~R3 Fluorescent, nontoxic, nanometer-sized materials gold nanoclusters Scattering~R6 useless Dickson et al, Phys. Rev. Lett. 93, 077402 (2004) History of Fluorescence from Gold Materials Robert M. Dickson • Encapsulating Au clusters by PMAMA dendrimers • QYs~50% • Size, 30*300 nm • Similar behavior to SPR • Orientation dependent emission Synthesis and Characterization of Gold NCs • NP fragmentation (6 nm-2 nm). • DHLA ligands for water soluble. • QYs~1 %. • Good colloidal stability. Collaborator: Prof. Chang, in CYCU Optical Properties of Ensemble Au NCs • No surface plasmon resonance features. • Broad band emission. Fluorescence properties of single gold NCs Incomplete shape : photobleaching phenomenon blinking behavior 30 Single Au NCs 10 ms bin time 25 Counts/bin 20 15 Single-step photobleaching 10 5 0 0 10 Observation time (s) 30 25 Counts/ms 20 15 10 5 Streaky pattern : blinking behavior 0 0 1 2 3 Observation time (s) 4 5 On/off-time distribution 1 1 10000 1000 0.1 100 1 2 3 4 On-time duration (ms) 5 6 Normalized events Events Normalized events 0.1 0.01 0.01 1 10 On-time duration (ms) 1 10 Off-time duration (ms) • Power-law distribution for on/off-times • Power-law exponents for on/off-times are 2, 1.8, respectively Fluorescence Lifetime Image Microscopy (FLIM) 1 Single NCs Normalized intensity (a.u.) ns 0.1 0.01 -2 0 2 4 6 8 Decay time (ns) 10 12 14 Specific labeling and nonspecific uptake Scale bar : 50 micron • Human hepatoma cells for specific labeling. • Streptavidin-biotin pairs. • Human aortic endothelial cells for nonspecific uptake. Ultrafast Dynamics in Metal NPs Pump-Probe Techniques – to achieve ~fs resolution fs (10-15 sec) ~ ps (10-12 sec) mm (10-6 m) ~ cm (10-2 m) (http:www.nims.go.jp) Relative surface energy: γ111 < γ100 < γ110 A B 2016/3/23 Thin film Prism Sphere Rod Disc Triangular pyramid 33 Silver Nanoprisms A B Oscillation component H = 31.4 nm, T = 8.5 nm 0 20 40 60 80 C Residuals (normalized) Residuals (normalized) zN(t)-z1(t), 0.04 H = 31.6 nm, T = 7.8 nm Residuals (normalized) Delay Time / ps H = 31.4 nm, T = 8.5 nm 0 2016/3/23 2 4 6 Delay Time / ps 8 34 References • • • • • • • • • Y. C. Yeh, C. T. Yuan, C. C. kang, P. T. Chou, J. ang, Appl. Phys. Lett. 93, 223110 (2008). P. Yu, J. Tang, S. H. Lin, J. Phys. Chem. C 112, 17133 (2008). J. Tang, Y. C. Yeh, P. T. Tai, Chem. Phys. Lett. 463, 134 (2008). J. Tang, J. Chem. Phys. 129, 084709 (2008). C. T. Yuan et al, Appl. Phys. Lett. 92, 183108 (2008). D. H. Lee, J. Tang, J. Phys. Chem. C 112, 15665 (2008). J. Tang, Chem. Phys. Lett. 458, 363 (2008). J. Tang, J. Chem. Phys. 128, 164702 (2008). J. Tang, Appl. Phys. Lett. 92, 011901 (2008). Thank you for your attention
