Notes for Grade 12 Maths Studies on the χ2 test of independence
advertisement

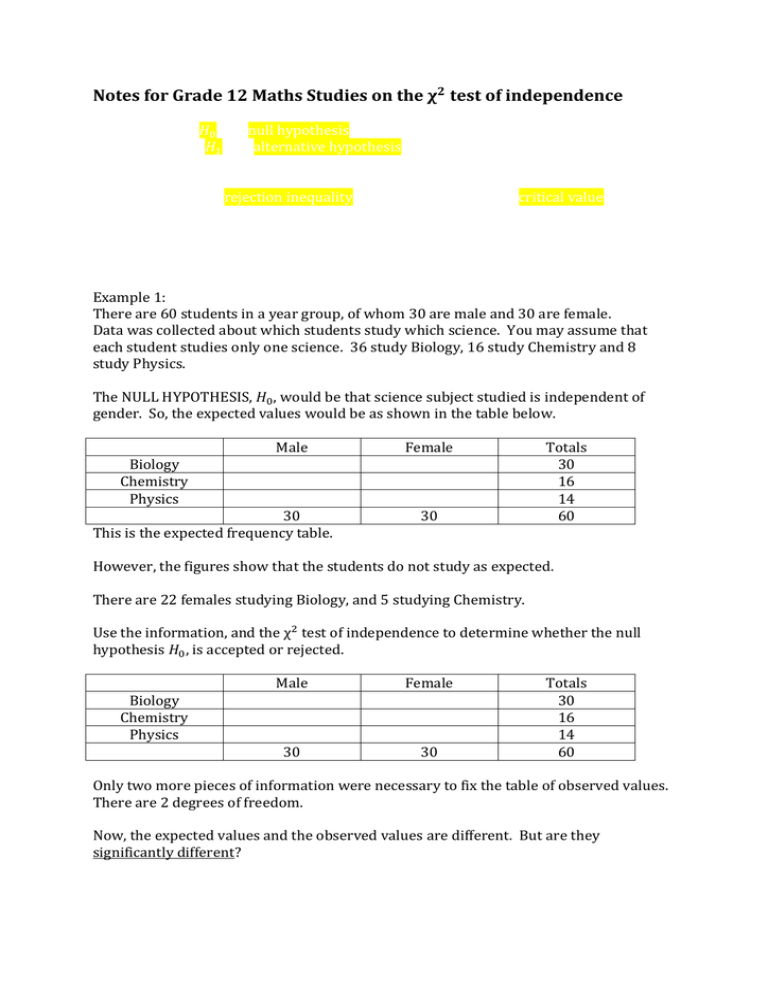
Notes for Grade 12 Maths Studies on the 𝛘𝟐 test of independence 1) State 𝐻0 , the null hypothesis: variable x is independent of variable y. (State 𝐻1 , the alternative hypothesis: variable x is not independent of variable y.) NB the alternative hypothesis is NOT that x is dependent on y. 2 2) State the rejection inequality 𝜒𝑐𝑎𝑙𝑐 > 𝑘, where k is the critical value of 𝜒 2 . 3) Construct the expected frequency table. 4) Find χ2 , use the calculator in an exam, but do the table in your project. 5) Either accept or reject 𝐻𝑜 using the critical value or the p-value. 6) Interpret your results! Example 1: There are 60 students in a year group, of whom 30 are male and 30 are female. Data was collected about which students study which science. You may assume that each student studies only one science. 36 study Biology, 16 study Chemistry and 8 study Physics. The NULL HYPOTHESIS, 𝐻0 , would be that science subject studied is independent of gender. So, the expected values would be as shown in the table below. Male Biology 15 Chemistry 8 Physics 7 30 This is the expected frequency table. Female 15 8 7 30 Totals 30 16 14 60 However, the figures show that the students do not study as expected. There are 22 females studying Biology, and 5 studying Chemistry. Use the information, and the χ2 test of independence to determine whether the null hypothesis 𝐻0 , is accepted or rejected. Biology Chemistry Physics Male 8 11 11 30 Female 22 5 3 30 Totals 30 16 14 60 Only two more pieces of information were necessary to fix the table of observed values. There are 2 degrees of freedom. Now, the expected values and the observed values are different. But are they significantly different? 𝑓𝑜 𝑓𝑒 𝑓𝑜 − 𝑓𝑒 (𝑓0 − 𝑓𝑒 )2 8 22 11 5 11 3 15 15 8 8 7 7 -7 7 3 -3 4 -4 49 49 9 9 16 16 Total (𝑓0 − 𝑓𝑒 )2 𝑓𝑒 3.267 3.267 1.125 1.125 2.286 2.286 13.355 2 So for this situation 𝜒𝑐𝑎𝑙𝑐 =13.355. We look at the table of critical values in your text book and see that for 2 degrees of freedom at 5% significance, the critical value is 5.99. 2 Since 13.355> 5.99, then 𝜒𝑐𝑎𝑙𝑐 > critical value, then we reject the null hypothesis and accept the alternative hypothesis. Thus we can say that at 5% significance Science studied is not independent of gender. In an examination you would need to be able to do this on a calculator. You would not have a table of values to look up, so you would use the p-value. To do χ2 test on the calculator, enter your table of observed values as a matrix. [2nd, 𝑥 −1, edit, 1, rows, columns, then go to Stat, test, c: χ2 test] You will see χ2 , p and df. In this case, from the calculator, the p value is 0.001259, which is less the 0.05 (5% in decimal), so we reject the null hypothesis. Example 2: Of 60 grade 12 students, 30 males and 30 females, 34 play basketball, of whom 22 are boys. Is playing basketball independent of gender? 𝐻𝑜 : playing basketball is independent of gender. 𝐻1 : playing basketball is not independent of gender Observed Frequency table (contingency table): Male Female Plays basketball 20 14 34 Does Not Play BB 10 16 26 30 30 60 One degree of freedom (r-1)(c-1)=1 Expected frequency table: Male Female Plays basketball 34 × 30 = 17 60 34 × 30 = 17 60 34 Does Not Play BB 26 × 30 = 13 60 26 × 30 = 13 60 26 30 30 60 2 Since the degree of freedom is only one we have to find 𝜒𝑐𝑎𝑙𝑐 using the Yates’ continuity correction. 𝑓𝑜 𝑓𝑒 𝑓𝑜 − 𝑓𝑒 |𝑓𝑜 − 𝑓𝑒 | |𝑓𝑜 − 𝑓𝑒 | − 0.5 20 10 14 16 17 13 17 13 3 -3 -3 3 3 3 3 3 2.5 2.5 2.5 2.5 (|𝑓𝑜 − 𝑓𝑒 | − 0.5)2 (|𝑓𝑜 − 𝑓𝑒 | − 0.5)2 𝑓𝑒 6.25 0.8929 6.25 0.4808 6.25 0.8929 6.25 0.4808 Total 2.7474 Using the table shown in example 1, the critical value at 5% significance for 1 degree of freedom is 3.84. 2 Since 𝜒𝑐𝑎𝑙𝑐 ≈ 2.75, which is < 3.84, we do not reject 𝐻0 . NB The calculator does not use the Yates’ continuity correction, so gives a different 2 value of 𝜒𝑐𝑎𝑙𝑐 , but in this case it still leads to the same conclusion, i.e. that we do not reject 𝐻0 . We conclude that at a 5% level of significance, the variables gender and playing basketball are independent.


