Phase Diagrams Phase
advertisement
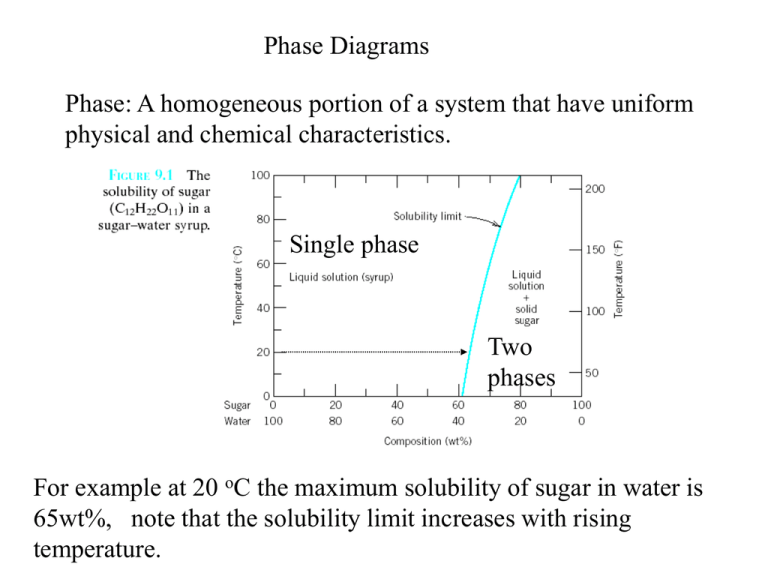
Phase Diagrams Phase: A homogeneous portion of a system that have uniform physical and chemical characteristics. Single phase Two phases For example at 20 oC the maximum solubility of sugar in water is 65wt%, note that the solubility limit increases with rising temperature. COMPONENTS AND PHASES • Components: The elements or compounds which are mixed initially (e.g., Al and Cu) • Phases: The physically and chemically distinct material regions that result (e.g., a and b). AluminumCopper Alloy Adapted from Fig. 9.0, Callister 3e. Temperature Equilibrium phase diagrams represent the relationship between temperature and the compositions and the quantities of phases present at equilibrium. It can be considered as a map that determine the phases depending on composition and temperature. 100% A Map of phases present 10 20 Wt% of B B 100% Solid solution: It exist when different atoms take part in building a crystal lattice (single phase). Type of solid solutions: A. Substitutional solid solution B. Interstitial soild soltion In both cases solute atoms completely dissolve (no limit to solubility) in the host metal forming a single phase. Temperature Cooling curve of pure metals L Tm S Time Pure metals Pure metals solidifies at a constant temperature which is known as the melting temperature L Ts L+S Tf S Time Binary alloys Temperature Temperature Cooling curve of binary alloys: Range of solidification temperature L Ts L+S Tf S Time Binary alloys Binary alloys solidifies over a range of temperatures. Solid solution phase diagram: How to construct a phase diagram from cooling curves? Draw the cooling curves of different composition alloys, the upper inflection point form a loci for the liquidus line, the lower inflection point form a loci for the solidus line. Melting temp. of Ni Solid solution phase Melting temp. of Cu Some notes about the phase diagram: •The liquid L is a homogeneous liquid solution of both copper and nickel. •The a phase is a substitutional solid solution consisting of both copper and nickel atoms, and having FCC crystal structure. •Below 1080 C there is complete solubility between copper and nickel (same crystal structure FCC, nearly equal atomic radii, and electronegativity and similar valency). •Melting temperatures for pure nickel is 1085 C and for pure nickel is 1453C. •Copper nickel system is termed isomorphous because of this complete liquid and solid solubility. •For each particular composition and temperature the number and type of phases can be pointed out. PHASE DIAGRAMS: number and types of phases • Rule 1: If we know T and Co, then we know: --the # and types of phases present. • Examples: Cu-Ni phase diagram Adapted from Fig. 9.2(a), Callister 6e. (Fig. 9.2(a) is adapted from Phase Diagrams of Binary Nickel Alloys, P. Nash (Ed.), ASM International, Materials Park, OH, 1991). PHASE DIAGRAMS: composition of phases a. Construct a tie line across the two phase region b. Intersection of the tie line and the phase boundaries on either sides are noted. c. Perpendiculars are dropped from these intersection to the horizontal composition axis For an alloy of composition 35%Ni, 65%Cu, determine the phase composition at 1250 C Ca If only one phase is present, for example a composition of 60% Ni40 %Cu at 1100C (point A), only the a phase is present. The composition of this phase is the same as the composition of the alloy, which mean that the composition of a is 60% Ni-40 %Cu .
