Using Technology to Help Middle School Students Identify with
advertisement
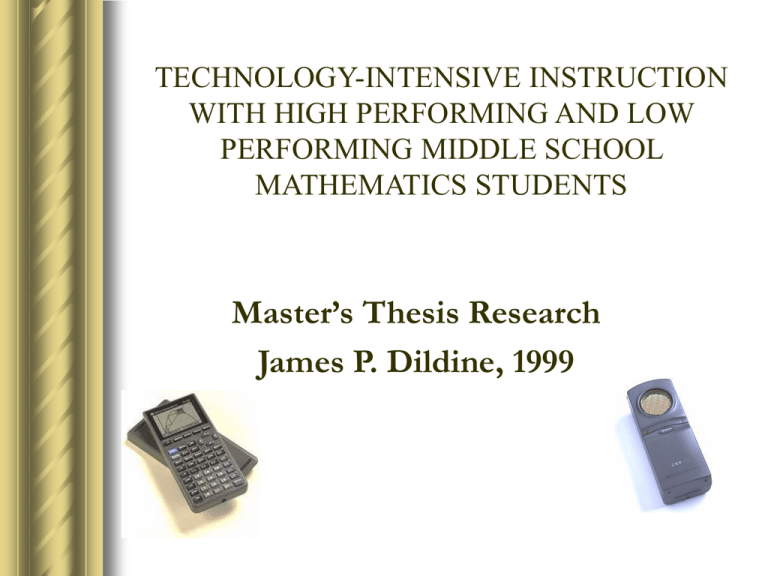
TECHNOLOGY-INTENSIVE INSTRUCTION WITH HIGH PERFORMING AND LOW PERFORMING MIDDLE SCHOOL MATHEMATICS STUDENTS Master’s Thesis Research James P. Dildine, 1999 Introduction NCTM recommends Utilizing technology to help all students learn mathematics. PCAST- President’s Report on Technology in Education – Learn through not the technology – Equitable Universal Access Calculators put hand-held technology in all students’ hands Background Literature Steele-academic disidentification, “process that occurs when people stop caring about their performance in an area, or domain that formerly mattered a great deal.” Hill- “many intrinsic qualities of a traditional mathematics classroom offer motives for student disidentification from mathematics.” Oakes-Low tracked classes require more rote memorization and less critical thinking than high tracked classes where teachers pursue understanding of complex themes. Background Literature Mevarech and Kramarsky (1997) report that graphing involves interpretation - the ability to read a graph and gain meaning from it - and construction - building a graph from data or points. NCTM Emphases include appropriate calculators should be available to all students at all times; a computer should be available in every classroom for demonstration purposes; every student should have access to a computer for individual and group work; Students should learn to use a computer as a tool for processing information and performing calculations to investigate and solve problems. Students using graphing technology Dunham-review of calculator research (1993) Students who use graphing calculator technology can better read and interpret graphical information; obtain more information from graphs; have greater overall achievement on graphing items; are better at finding an algebraic representation for a graph better understand global features of functions; better understand connections among graphical, numerical, and algebraic representations; had more flexible approaches to problem solving, were more willing to engage in problem-solving and stayed with a problem longer; and concentrated on math problems and not on algebraic manipulation; Research Design Technology Intensive Instruction in Middle School classrooms Two weeks of instruction Two 8th grade Math classes: Basic, Algebra Equipment: TI-82 and CBR Activities reading and interpreting information from graphs while learning about rate Two Classes Algebra & Basic Math Demographics Basic Math Male White Black Latino/a Asian Mid Eastern Totals Percent 5 4 1 0 0 10 43 Female Totals Percent 11 16 70 2 6 26 0 1 4 0 0 0 0 0 0 13 23 100 57 100 Algebra Male 6 1 0 2 1 10 53 Female Totals Percent 8 14 74 1 2 10.5 0 0 0 0 2 10.5 0 1 5 9 19 100 47 100 Equipment TI - 82 Graphing Calculator CBR - Calculator Based Ranger Connects to calculator to act as a realtime data collection device Distance a walker is away from sensor is plotted as a graph of distance v. time on calculator Instructional Activities Match-the-graph – Students are presented with a graph and expected to match the shape of that graph by directing walker properly Match-your-graph – Students create their own graph on paper and attempt to recreate it on the equipment Determine speed – Students measure the change in distance over an interval vs. change in time. Data Collection Survey Items - Attitudes toward mathematics and technology Achievement Items - Items about knowledge of reading graphs and determining rate Classroom observations/Videos Interview of 4 students (each class) 3 each as case studies Survey Item Results Percentages of favorable responses More favorable responses on the post survey. Achievement Results Statistically Significant Gains for each class Basic Math Mean: 3.53 to 4.27 – (p=.02, t=2.32, df=14) Algebra Mean: 8.32 to 9.11 – (p=.01, t=2.80, df=18) Observations: Basic Math Class Students actively participating Collaborative learning environment promoted negotiation and exploration Students presented what they discovered and explored ideas Related activities beyond classroom: Transfer of meters/second to miles/hour Difficulty identifying specific points Observations: Algebra Class Students worked together in groups but consistently worked individually on the activities Attempted to make graphs that were not possible (vertical lines) Also transferred graphing ideas to situation beyond the classroom Most were able to use specific end points to determine average speed over an interval Snapshot 1-Big Ideas Horizontal Line - No movement. Change in x but no change in y Dip and Peak-Represent points where walker stopped and changed direction. Indicate specific point where no change in y (distance) but brief change in x (time). Vertical line - Not possible - requires enormous change in y (distance) with little or no change in x (time). Snapshot 2-Basic Math Group "woman backs up for a few feet. pauses, switches into drive, and pulls forward for about half the distance. Pauses again and backs up a few more feet, pauses again and pulls all the way out and drives off." Snapshot 3 - Ashley’s Bus Trip Math: Boring but important to consumers • "Going to the store, yes. Like seeing if the person gives you the right amount of change." Evidence of identifying with ideas • "It was fun and I think the school should get some of those calculators.” • Now: “I think about the bus like a graph” Snapshot 4 - Michael View of math: review/useless • in high school you do lots of algebraic word problems or something, and some of that you’ll never use in your life Chalk-Board Explanation = moving away from the motion sensor and = back toward the sensor Snapshot 4 - Algebra “Cheats” Vertical Line - impossible to create “We can make it” “We just need to find a way that makes large distance changes in almost no time” Example of a “cheat”, student jumping in and out of the range of the sensor. Snapshot 5 - Calculate Speed Algebra students traced specific points to determine speed over an interval Distance End Distance Start 2 .5 m 2 .0 .5m 1m Time Finish Time Start 16.5s 10.5s 6.5s 13s Conclusions - What did this Tell Me? Basic Mathematics Students were able to “handle” the technology and concepts Lowest tracked students performed very well within this type of instruction Most Students were motivated to learn the material. Each class attained conceptual knowledge Evidence of more positive attitudes during instruction Limitations May not generalize beyond these classes Achievement tests were limited to ten items and may not have linked directly with instruction Survey items may need better selection Implications & Recommendations Pilot included instruction to teachers and preservice teachers - can they use this type of instruction in their classrooms? When and at What level should graphing concepts be introduced? Are lower tracked classes capable of learning complex concepts in this environment? Further Study More classes More time necessary with technology instruction - novelty of research environment More concepts Transfer of concepts - Do the students use the knowledge they may have gained later? Do the students retain the positive attitudes they may have exhibited? Fin James P. Dildine, 1999
