Wells Fargo & Co. WFC
advertisement
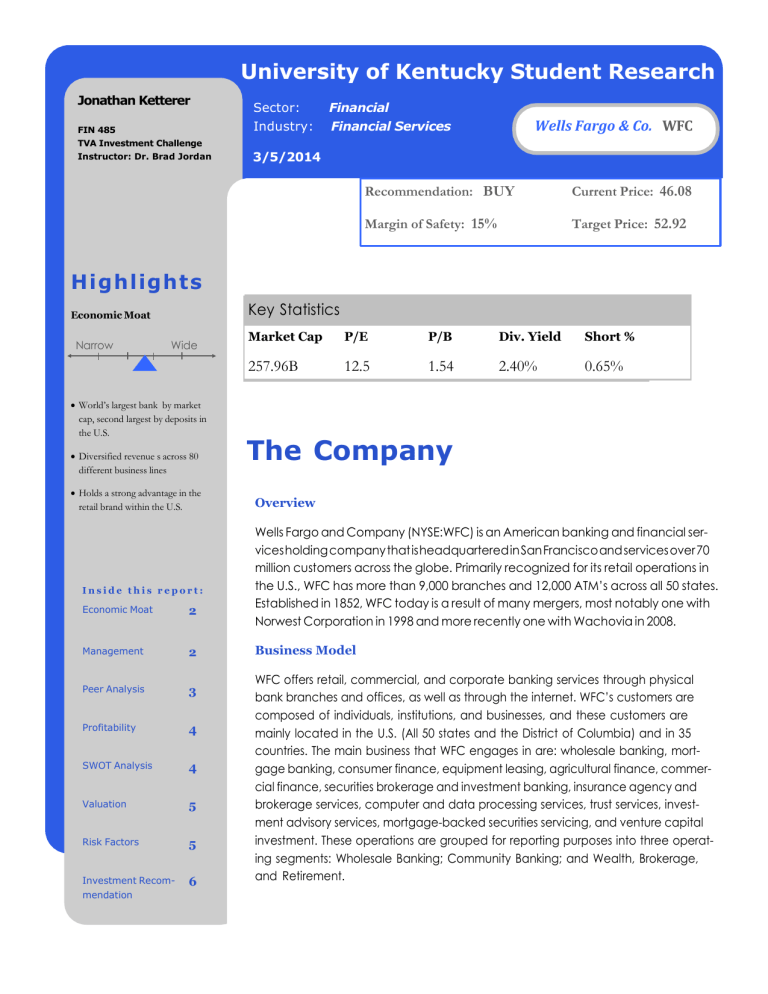
University of Kentucky Student Research Jonathan Ketterer FIN 485 Sector: Financial Industry: Financial Services Wells Fargo & Co. WFC TVA Investment Challenge Instructor: Dr. Brad Jordan 3/5/2014 Recommendation: BUY Current Price: 46.08 Margin of Safety: 15% Target Price: 52.92 Highlights Key Statistics Economic Moat Narrow Wide World’s largest bank by market cap, second largest by deposits in the U.S. Diversified revenue s across 80 different business lines Holds a strong advantage in the retail brand within the U.S. Inside this report: Economic Moat 2 Management 2 Peer Analysis 3 Profitability 4 SWOT Analysis 4 Valuation 5 Risk Factors 5 Investment Recom- 6 mendation Market Cap P/E P/B Div. Yield Short % 257.96B 12.5 1.54 2.40% 0.65% The Company Overview Wells Fargo and Company (NYSE:WFC) is an American banking and financial services holding company that is headquartered in San Francisco and services over 70 million customers across the globe. Primarily recognized for its retail operations in the U.S., WFC has more than 9,000 branches and 12,000 ATM’s across all 50 states. Established in 1852, WFC today is a result of many mergers, most notably one with Norwest Corporation in 1998 and more recently one with Wachovia in 2008. Business Model WFC offers retail, commercial, and corporate banking services through physical bank branches and offices, as well as through the internet. WFC’s customers are composed of individuals, institutions, and businesses, and these customers are mainly located in the U.S. (All 50 states and the District of Columbia) and in 35 countries. The main business that WFC engages in are: wholesale banking, mortgage banking, consumer finance, equipment leasing, agricultural finance, commercial finance, securities brokerage and investment banking, insurance agency and brokerage services, computer and data processing services, trust services, investment advisory services, mortgage-backed securities servicing, and venture capital investment. These operations are grouped for reporting purposes into three operating segments: Wholesale Banking; Community Banking; and Wealth, Brokerage, and Retirement. 2 Economic Moat Wells Fargo & Co. WFC Jonathan Ketterer FIN 485 TVA Investment Challenge Instructor: Dr. Brad Jordan WFC’s economic moat is moderate given the commodity-like nature of money and the nature of the services it offers. A majority of the moat arises from the position of the company as one of the four big banks that operate in America, the other three being Bank of America (BAC), JPMorgan (JPM), and Citigroup (C). Among these three competitors, WFC is second in deposit market share, with growth in the past couple of years that is closingthe gap between it and Bank of America. WFC is also well known for its retail operation, providing banking services such as checking, savings, and brokerage accounts to its customers, while still maintaining and growing its large commercial business. It is also worth noting that the customer base WFC has attracted is rather sticky in nature in that it is typically a hassle for customers to switch their banking provider. Cross-selling products across this large customer base is also a strongsuit with WFC, providing it access to existing customers with its broad product variety. WFC is also #1 in commercial real estate originations, middle market commercial lending, small business lending, auto lending, mortgage origination, and mortgage servicing. On the operational front, WFC is the most profitable amongst the big four banks in terms of ROAE, ROAA, and Net Interest Margin. WFC is also a sec- tor leader with its low efficiency ratio, which demonstrates its ability to maintain revenue generation at a low cost. Management WFC has a management team composed of 7 long-tenured leaders. The CEO John G. Stumpf has spent 31 years with the company or its predecessors, holding his current position since 2007. CFO Timothy J. Sloan has also spent a good deal of his career with the company or its predecessors, with 25 years in total, and 3 years in his current role. The head of Wealth, Brokerage & Retirement Services is David M. Carroll, who has spent 31 years with the company, but spent the first 25 with Wachovia, where he was head of the Capital Management Group, which included retail brokerage, asset management, and retirement and investment products. Controller Richard D. Levy joined WFC at his current position in 2002, with 18 years of public accounting and financial services prior to his onboarding. The head of the wholesale banking operation is David A. Hoyt. Hoyt has spent with 31 years with WFC. In all, the CEO’s direct reports have an average tenure with WFC of 28 years. The tenured and experienced management team at WFC displays a bright showing of consistency and performance. University of Kentucky Student Research 3 3/5/2014 Peer Analysis Competitors WFC faces stiff competition from its main three competitors BAC, JPM, and C. On occasion, due to the similar styles and metrics, WFC is also compared to U.S. Bancorp (USB), although the drastic difference in assets makes this a less clear comparison. Amongst the big four banks, WFC leads the pack in most metrics, aside from valuation, and focuses heavily on retail operations as shown through its position as the #1 mortgage originator. In deposit market share and debit card issuance, WFC falls second to BAC, but is gaining in both segments while BAC has seen declines. In regards to C, WFC fares (?) similarity in operations, but the focus of C on its international seg- ments and merchant processing segment differentiates the two. JPM is about the middle of the road with diver- sified revenues, but also has a larger exposure to investment banking and equity trading. Key Statistics While WFC has a higher P/E than most of the competitors shown here, this likely displays the premium that investors have agreed to pay for the profitability measures that are well ahead of the peer group. With an efficiency ratio of 57.87%, WFC again leads the big four banks and displays an excellent ability to contain non-interest expenses associated with revenue generation. In terms of tangible common equity, WFC falls second only to C. In this regard, however, WFC continues to compensate for its premium with profitability measures. Ticker WFC USB BAC JPM C Mkt Cap ($000) EPS LTM 257.07 78.80 183.57 230.62 152.34 3.95 3.01 0.94 4.36 4.36 P/E 12.58 14.37 11.32 9.17 10.24 Effic Ratio OPM (%) 12/31/13 39.76 38.78 17.89 36.39 19.21 57.87% 54.86% 79.75% 62.62% 70.24% Tot Assets ($000) 1,527 364 2,102 2,415 1,880 TCE Ratio 12/31/13 8.30 6.72 7.10 6.36 9.05 4 Profitability Wells Fargo & Co. WFC Ticker ROAE LTM ROAA LTM (%) (%) Net Interest Margin LTM (%) Noninterest Inc/ Operating Rev LTM (%) Jonathan Ketterer C 0.75 7.11 2.93 37.84 FIN 485 BAC 0.53 4.89 2.46 50.15 JPM 0.75 8.64 2.23 53.59 USB 1.63 13.88 3.44 45.25 WFC 1.53 13.47 3.39 48.02 TVA Investment Challenge Instructor: Dr. Brad Jordan In terms of profitability, as seen from the chart above, WFC leads the big four with outstanding metrics well-ahead of the peer group. As noted earlier, similarities can be seen between USB and WFC given the two banks’ styles and heavy involvement in wholesale and consumer banking. In this regard also, as shown earlier, the efficiency ratio is worth noting when considering profitability. USB and WFC have shown excellent performance in keeping non-interest expenses to a minimum, likely given the larger investment banking practices of BAC and JPM, and the equities trading operations of C and JPM, which also carry risk WFC has kept minimized through smaller operations. The net interest margin represents here WFC’s ability to make more money on its investments than its interest expenses, a crucial indicator of a healthy, profitable bank. In the last column, noninterest income over operating reve- nue is shown to display that WFC keeps a diversified stream of revenues, which come from miscellaneous fees, brokerage & wealth services, insurance, and a small invest- ment banking operation. SWOT Analysis University of Kentucky Student Research 5 3/5/2014 Valuation In the valuation of WFC, I used SNL’s Bank Valuation Model, which allowed for input of asset yields and asset growth rates, which I believe allowed for a more specific valuation of the stock price. Yahoo! Finance’s price target is a consensus of the sell-side analysts that Yahoo! publishes. The Bloomberg Terminal’s DDM model provided a value that was right in between that of the SNL price and Yahoo’s. Valuation Margin Safety SNL Yahoo! Finance 7% Bloomberg P(DDM-PE) 11% $56.87 23.4% For the P(DDM-PE) model, using Value Line figAverage $52.55 14% ures and growth rates, the highest value of $56.87 was given. This appears bullish given Value Line’s estimate of an upside of $75.00 was well above that of most sell-side analysts covering the stock. Given these fivevalues, the value I found to most accurately price the stock was SNL’s model, considering it allowed for the input of factors other than those of the other models. Risk Factors WFC appears to be rather risk-averse when it comes to the financial sector, given its diversified revenue streams, well-capitalized status, and its peer-leading profitability ratios. However, despite these large strengths, some risks exist. WFC is very exposed to U.S. economy and its development as a whole. The understanding that most of WFC’s assets are dependent on its customers paying them the interest and principal is a very broad way to look at this situation. John Stumpf has said, however, that he believes interest rate risk is something that bankers should be more concerned with than bad debt at this point in the economy’s cycle. While most banks, including WFC, are in a position where they stand to benefit from rising interest rates, it is plain to see that investors would prefer to side with the more floating rate sensitive institutions. In this regard, WFC is well situated, but it has been reported that it is not as floating rate sensitive as some of the other larger banks,. Another risk facing the company is the capital ratios that are set to be mandated in a few years. This should not be a problem as we see it now, given that WFC is well-capitalized and on-track to meet those standards set forth by the Federal Reserve and Basel Committees. Another issue for WFC is that it has been made public that due to the slowdown in mortgage refinances and originations, WFC will plan to lower its credit score limit in its consumer lending practices. This could make WFC more susceptible to bad credit issues, which predominantly caused the recession in 2008. WFC is also heavily regulated as one of the largest banks and given its SIFI (Systemically Important Financial Institution) status. WFC reports to many regulators. Among the most notable are the Office of the Comptroller of the Currency, the Federal Reserve Board, the Securities and Exchange Commission, and the Consumer Financial Protection Bureau. The Dodd-Frank Act of 2010 is also a concern for risk that has yet to be fully revealed. Within this Act, risks lie in the CFPB’s creation, which monitors the retail operations of banks, of which WFC is very exposed to. The Volcker Rule also regulates the investment operations of banks, which may possibly put the growth and operations of WFC’s investment banking and equities operations at risk. 6 A WfellalscFIanrcg.o &ACF o.LWFC Jonathan Ketterer FIN 485 TVA Investment Challenge Instructor: Dr. Brad Jordan Investment Recommendation WFC is, in my opinion, most certainly worthy of an investment of around 4.5-6% investment in our portfolio. I believe it matches the risk profile and return ability that we are after. Also given the portfolio’s lack of financials beyond Aflac and Visa, it would be wise to open up ourselves to some exposure, especially with the banking industry’s recently shown ability to return value to its shareholders through dividends and price appreciation. WFC is also what I believe to be the best pick amongst the banks currently given its size as a big four, providing us with some moat, and through its profitability. Its industry-leading lending practices in real estate, consumer, small business, and commercial markets makes it a largely obvious choice for meeting our portfolio’s aim to find a moat. While C may appear to be more attractive on a valuation perspective given its low Price to Book (75%), the international exposure to political risk and multiple interest rate environments may make this stock not as suitable for our portfolio as WFC. Sources University Bloomberg terminal www.sec.com/edgar www.morningstar.com www.finance.yahoo.com www.valueline.com www.wellsfargo.com www.snl.com of Kentucky Student Research
