DNAPL - CLU-IN
advertisement
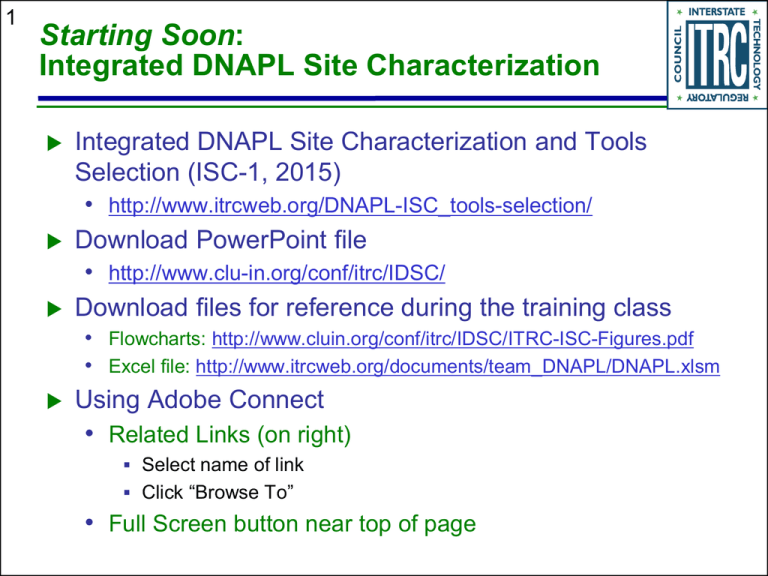
1 Starting Soon: Integrated DNAPL Site Characterization Integrated DNAPL Site Characterization and Tools Selection (ISC-1, 2015) • http://www.itrcweb.org/DNAPL-ISC_tools-selection/ Download PowerPoint file • http://www.clu-in.org/conf/itrc/IDSC/ Download files for reference during the training class • Flowcharts: http://www.cluin.org/conf/itrc/IDSC/ITRC-ISC-Figures.pdf • Excel file: http://www.itrcweb.org/documents/team_DNAPL/DNAPL.xlsm Using Adobe Connect • Related Links (on right) Select name of link Click “Browse To” • Full Screen button near top of page 2 Welcome – Thanks for joining this ITRC Training Class Integrated DNAPL Site Characterization and Tools Selection Integrated DNAPL Site Characterization and Tools Selection (ISC-1, 2015) Sponsored by: Interstate Technology and Regulatory Council (www.itrcweb.org) Hosted by: US EPA Clean Up Information Network (www.cluin.org) 3 Housekeeping Course time is 2¼ hours This event is being recorded Trainers control slides • Want to control your own slides? You can download presentation file on Clu-in training page Questions and feedback • Throughout training: type in the “Q & A” box • At Q&A breaks: unmute your phone with #6 to ask out loud • At end of class: Feedback form available from last slide Need confirmation of your participation today? Fill out the feedback form and check box for confirmation email and certificate Copyright 2015 Interstate Technology & Regulatory Council, 50 F Street, NW, Suite 350, Washington, DC 20001 4 ITRC (www.itrcweb.org) – Shaping the Future of Regulatory Acceptance Host organization Network • State regulators All 50 states, PR, DC Disclaimer • Full version in “Notes” section • Partially funded by the U.S. government • Federal partners ITRC nor US government warranty material ITRC nor US government DOE DOD endorse specific products EPA • ITRC Industry Affiliates Program • ITRC materials copyrighted Available from www.itrcweb.org • Technical and regulatory guidance documents • Academia • Community stakeholders • Internet-based and classroom training schedule • More… 5 Meet the ITRC Trainers Michael B. Smith Vermont DEC Montpelier, VT 802-249-5826 michael.b.smith @state.vt.us Tamzen Macbeth CDM Smith Helena, MT 208-904-0238 Macbethtw @cdmsmith.com Alec Naugle California Water Boards Oakland, CA 510-622-2510 anaugle@ waterboards.ca.gov Nathan Hagelin AMEC Foster Wheeler Environment & Infrastructure Portland, ME 207-828-3508 nathan.hagelin@amec.com Heather Rectanus Battelle Madison, WI 608-824-9191 rectanush@battelle.org 6 The Problem: Dense Non-Aqueous Phase Liquid (DNAPL) Sites Not achieving cleanup goals Spending time and money, but substantial risk remains Common site challenges • Incomplete understanding of DNAPL sites • Complex matrix – manmade and natural • Unrealistic remedial objectives • Selected remedy is not satisfactory Coal Tar 7 Poll Question For sites that you work on, what year did cleanup activities begin? Poll Question • Please provide a short answer 8 The Problem: Outdated DNAPL Site Characterization Concepts Considered contaminant flow was similar to groundwater flow Simplifying assumptions in equations based on Darcy flow led to inadequate characterization of • Site geologic heterogeneity 1980’s view • Contaminant Distribution Characteristics Behavior This approach limited success of site remediation activities Plume Receptor Receptor 9 The Solution: An Integrated DNAPL Site Strategy ITRC Technical and Regulatory Guidance Document: Integrated DNAPL Site Strategy (IDSS-1, 2011) Comprehensive site management Use at any point in site lifecycle Key topics • Conceptual site model (CSM) • Remedial objectives • Remedial approach • Monitoring approach • Evaluating your remedy Associated Internet-based training ITRC IDSS-1, Figure 1-2 10 Adding to the Solution: Integrated Handout DNAPL Site Characterization provided ITRC Technical and Regulatory Guidance Document: Integrated DNAPL Site Characterization (ISC-1, 2015) Benefits More accurate conceptual site models (CSMs) Improved predictability of plume behavior and risks More defensible knowledge of contaminant distribution Facilitates communication Reduced uncertainty Better performing remedies ITRC ISC-1, Figure 4-1 11 Incorporated into the Solution: New DNAPL Site Characterization Approaches Heterogeneity replaces homogeneity Anisotropy replaces isotropy Diffusion replaces dispersion Back-diffusion is a significant source of contamination and plume growth Non-Gaussian distribution Transient replaces steady-state conditions Nonlinear replaces linear sorption Non-ideal sorption replaces ideal sorption 12 After this training you should be able to: Apply the ITRC document to develop and support an Integrated DNAPL Site Characterization approach Understand what characteristics of site conditions must be considered when developing an informative DNAPL conceptual site model (CSM) Defining an integrated DNAPL characterization strategy Understand what tools and resources are available to improve the identification, collection, and evaluation of appropriate site characterization data Navigate the DNAPL characterization tools table and select appropriate technologies to fill site-specific data gaps 13 If you gain nothing else: Geology Controls DNAPL Mobility! Soil heterogeneity leads to differences in subsurface pore structure and capillary properties Significant variations can occur over very small distances/ intervals NAPL migration is strongly influenced by the topography of geologic layers ISC-1, Chapter 2 Photo Courtesy of Fred Payne, Arcadis, Inc 14 Training Overview DNAPL Characteristics Life Cycle of a DNAPL Site Integrated Site Characterization • Plan • Tools Selection • Implementation Summary ISC-1, Chapter 2 15 DNAPLs – Not Just Chlorinated Solvents! PCE in Soil Core Mixed Aged Motor Oil/Bunker, Aryl Phosphate and PCB in Soil Core Coal Tar 16 DNAPL Types Common types of DNAPLs • Chlorinated solvents • Coal tar • Creosote • Heavy petroleum such as some #6/Bunker fuel oil products • Oils containing Polychlorinated biphenyls (PCBs) 17 Poll Question Poll Question What DNAPLs do you have at your sites? (select all the apply) • • • • • • • • • Chlorinated solvents Coal tar Creosote Heavy petroleum hydrocarbons PCBs Pesticides Mercury See Table 2.1 Physical Other properties of example NAPLs None & reference fluids 18 Important DNAPL Properties Affecting Mobility DNAPL Chemical & Physical Properties Volatility Composition Modified from ISC-1, Chapter 2 19 DNAPL Density Describes the mass per unit volume of the DNAPL and is sometimes expressed as specific gravity (SG), which is the density relative to water By definition, all DNAPLs have a SG greater than 1.0 Some DNAPLs have a SG >1.5 (e.g., PCE) While others have a SG barely greater than water Gravitational forces overwhelm hydraulic gradients 20 DNAPL Aqueous Solubility (Cw,sol) Amount of a compound that dissolves in water at equilibrium DNAPL Component Density (g/mL) Solubility (mg/L) Types of Sites Trichloroethylene (TCE) 1.46 1,100 Solvent Pentachlorophenol (PCP) 1.98 20 Wood Treatment Acid Tar (H2SO4 & Hydrocarbons) 1.84 Miscible Refineries • Often different in site groundwater than in the laboratory Influences loss of mass to plume and trapped soil water 21 DNAPL Viscosity (Dynamic) Represents the resistance to shear (flow) of the fluid Temperature dependent • µw = 0.894 cP 25 oC • µw = 1.002 cP 20 oC Viscosity, µ (cP) 400 Coal Tar 1 Coal Tar 2 Coal Tar 3 200 0 20 30 40 50 o Temperature, T ( C) Influences mobility in the subsurface 22 DNAPL Volatility Volatility - Henry’s Constant (KH) Vapor Pressure (VPsat or P0) Vapor (gas phase) Water (+ dissolved contaminant) See also ITRC’s Vapor Intrusion Pathway: A Practical Guideline (VI-1, 2007) Influences mass loss in the unsaturated zone and risk of vapor intrusion (VI) 23 DNAPL Composition Properties of mixed DNAPL are different from pure component properties • Chlorinated solvents often include other compounds such as grease, oils or stabilizers • For mixed sources, chlorinated compounds from DNAPL could partition into LNAPL • NAPL weathering occurs in subsurface Coal Tar – Water Interfacial Films Loss of the soluble fraction of the NAPL Analysis of both the chemical and physical properties of your NAPL is recommended, if a NAPL sample can be collected 24 DNAPL Interactions with the SubSurface Media Affecting Mobility The following properties significantly affect the interactions between DNAPLs and sub-surface media: Modified from ISC-1, Chapter 2 25 Interfacial Tension and Wettability Interact to control the capillary forces that govern NAPL migration Non Wetting Wetting Graphic from Stone Environmental Wettability of soils may change after exposure to NAPL Influences capillary pressure and vertical migration 26 Capillary Pressure (Pc) Represents the pressure difference between two fluids sharing pore space Pc = Pn + Pw (Bear, 1972) Where Pn is the NAPL pressure and Pw is the water pressure Pc is a non-linear function of S, with Pc increasing at greater saturation of the nonwetting fluid (Lenhard and Parker, 1987) Variance of pore spaces within geologic media can dictate vertical DNAPL migration Capillary Pressure of Coarser Layers and DNAPL Entry 5 DNAPL Pool Height (m) 27 DNAPL Pool 3 Capillary Barrier 1 Silt Creosote Coal tar Chlorinated Solvent Mixed DNAPL Fine Sand Medium Sand Coarse Sand Kueper et. Al. 2003, An illustrated Handbook of DNAPL Transport and Fate in the Subsurface 28 DNAPL Saturation Saturation, Relative Permeability, and Capillary Pressure Saturation (S) • S is the proportion (percentage) of the pore space occupied by a fluid (NAPL, air, or water) • Ranges from 0 to 1.0 (0 to 100%) Residual Saturation (Sr) • Sr is the saturation of NAPL remaining when NAPL is no longer mobile Strongly affected by geologic heterogeneity 29 NAPL Saturation and Mobility When S < Sr • NAPL will be immobile unless NAPL or solid phase properties change When S > Sr • NAPL may be mobile or potentially mobile • NAPL may be potentially mobile but not moving (Pennell et al., 1996, ES&T) Figure modified from ISC-1, Chapter 2 A continuous NAPL phase must be connected to transmit pressure head that overcomes the entry pressure and allows DNAPL to migrate 30 Groundwater Movement Through a DNAPL Zone Relative permeability (kr) The value of kr, ranges from 0 to 1.0 as a non-linear function of saturation (S) • kr for groundwater = 1.0 at DNAPL S=0 • kr for DNAPL approaches 1 at as DNAPL S approaches 1 (Parker and Lenhard 1987) figure modified from ISC-1, Chapter 2 The presence of NAPL reduces the effective hydraulic conductivity of the media 31 Training Overview DNAPL Characteristics Life Cycle of a DNAPL Site Integrated Site Characterization • Plan • Tools Selection • Implementation Summary ISC-1, Chapter 3 32 DNAPL Life Cycle – Classical Model Source Zone Evolution Active source Migrating DNAPL DNAPL vaporization DNAPL dissolution Kueper et al., 2013 33 Secondary Sources within Groundwater Plumes We are now revising our definition of “DNAPL Source Zone” The hunt for DNAPL is often distracting DNAPL is no longer considered the only source of groundwater contamination • Sorption/desorption from aquifer matrix • Matrix diffusion into/out of low K zones These mechanisms may control the longevity of dissolved phase plumes at DNAPL or former DNAPL sites 34 Redefining the DNAPL Source Term: Apparent Secondary Sources Areas impacted by DNAPL • DNAPL Source Areas • Unsaturated (Vadose) Zone Secondary Sources Sorption/ desorption to aquifer matrix • Slow Desorption from aquifer solids • DNAPL may have dissolved or the DNAPL may be remediated Molecular diffusion into low k zones • Matrix Diffusion from sources within plume Modified from ISC-1, Chapter 2 35 “Sorption” - Adsorption & Absorption A portion of the contaminant mass will adsorb/sorb to the aquifer matrix at equilibrium based on contaminant concentration and the contaminant’s affinity to the matrix CWater CSolid Water Cs Cw * f oc * K oc Solid (Soil) Contaminant mass will desorb from matrix into groundwater as “cleaner” groundwater migrates through system Desorption contributes to retardation and longevity of dissolved phase contaminant plumes 36 Matrix Diffusion: “Back Diffusion” Early time • Molecular Diffusion into low permeability zones in the aquifer matrix: “Matrix Diffusion” Late time • “Back Diffusion” out of low permeability zones into higher permeability zones ITRC IDSS-1, Figure 2-5 & 2-6 Back Diffusion contributes to retardation and longevity of dissolved phase contaminant plumes 37 Controlling Role of Geology in Matrix Diffusion Figure courtesy of Fred Payne, Arcadis 38 14-Compartment Model: Phase Distribution and Mass Transfer Source Zone Phase/Zone Low Perm. Transmissive Low Perm. Vapor Intrusion Vapor DNAPL Transmissive Plume NA Capillary Barrier NA Aqueous Sorbed Matrix Diffusion Matrix Diffusion Sorption ITRC IDSS-1, Table 2-2 from Sale and Newell 2011 The 14-Compartment Model helps Stakeholders align on the Life Cycle of the Site and Characterization Objectives 39 DNAPL Life Cycle – Early Stage ZONE SOURCE Lower-K PLUME Transmissive Transmissive Vapor LOW MODERATE DNAPL LOW HIGH Aqueous LOW Sorbed LOW Lower-K LOW LOW MODERATE MODERATE LOW MODERATE LOW LOW Kueper et al., 2013 40 Prolonged Early Stage Behavior Low solubility and high viscosity DNAPLs High DNAPL saturations and still immobile. Highly DNAPL saturation causes flow by-passing Coal tar and creosote sites may remain as Early Stage for generations 41 DNAPL Life Cycle – Middle Stage ZONE SOURCE Lower-K PLUME Transmissive Transmissive Vapor MODERATE MODERATE DNAPL MODERATE MODERATE Aqueous MODERATE Sorbed MODERATE Lower-K MODERATE MODERATE MODERATE MODERATE MODERATE MODERATE MODERATE MODERATE Kueper et al., 2013 42 Diffusion Replaces Dispersion in Dissolved Phase Plumes As the length scale of interest decreases Diffusion replaces Dispersion in plume behavior Geologic heterogeneity and anisotropy also lead to numerous small plumes within each groundwater plume Figures courtesy of Fred Payne, Arcadis 43 Heterogeneity Replaces Homogeneity Simplifying the subsurface as homogeneous & isotropic has not worked well for remediation-scale plume geometry Anisotropy replaces isotropy Non-ideal behavior is as pronounced in the vertical Borden Tracer Simulation – Combined Heterogeneity and Diffusivity Effects 3 Depth (m) 0 0 5 10 Distance (m) Figure courtesy of Fred Payne, Arcadis 44 DNAPL Life Cycle – Late Stage ZONE SOURCE Lower-K PLUME Transmissive Transmissive Vapor LOW LOW DNAPL LOW LOW Aqueous MODERATE Sorbed MODERATE Lower-K LOW LOW LOW LOW MODERATE LOW LOW MODERATE Kueper et al., 2013 45 Poll Question Poll Question Based on what we have just presented, and remembering that life-cycle phase is not only dependent on age of the site; what phase is your site? • Early • Middle • Late Select more than one if you have multiple sites in different phases 46 Understanding Your DNAPL CSM Characterizing sites contaminated with DNAPLs needs to take into account Geology • Depositional environment, media properties • Orientation of fractures, bedding planes Characteristics of the released DNAPL Distribution DNAPL in Subsurface Media Life-cycle of your DNAPL site • Roles of Matrix Diffusion and Non-ideal Sorption The objectives of the characterization and decisions that need to be made 47 Q&A Handout provided ITRC IDSS-1, Figure 1-2 ITRC ISC-1, Figure 4-1 48 Training Overview DNAPL Characteristics Life Cycle of a DNAPL Site Integrated Site Characterization • Plan • Tools Selection • Implementation Summary 49 Integrated Site Characterization Flexible, iterative 8-step process for CSM refinement Focus areas • Data resolution matches scale of heterogeneity • Objectives are clear and actionable • Tools are optimal for site conditions and data needs 50 Benefits of Integrated Site Characterization Reduces uncertainties to improve CSM Enables more efficient remedies • ITRC Integrated DNAPL Site Strategy (IDSS-1, 2012) Avoids costly do-overs Supports stakeholder needs and confidence 51 Integrated Site Characterization Plan characterization (1-4) • Define the problem • Identify data needs and resolution • Develop data collection objectives • Design data collection and analysis plan Select tools (5) Implement investigation and update CSM (6-8) 52 Poll Question Poll Question Do you have a DNAPL site that is being characterized for the first time or where prior characterization was insufficient? • Yes – first time • Yes – insufficient • No 53 Data Quality Objectives are “Built in” USEPA Data Quality Objectives Step 1: State Problem Step 2: Identity Goal of Study Step 3: Identify Information Inputs Step 4: Define Boundaries of Study Step 5: Develop Analytical Approach Step 6: Specify Performance or Acceptance Criteria Step 7: Develop Plan for Obtaining Data 54 Step 1: Define Problem and Assess CSM Uncertainties Assess existing CSM Define problem Define uncertainties Case Example 55 Case Example – Dry Cleaner Site 1. Commercial & residential location 2. Shallow groundwater (<20’ bgs) 3. Five MWs; 10-ft screens 4. 18 soil borings; 5-ft samples 5. No soil-gas evaluation 6. In situ chemical oxidation (ISCO) & enhanced in situ bioremediation (EISB) injections in source area & plume Groundwater Plume Area N Garage Dry Cleaner Gasoline Station Garage Garage Vacant Garage Residence 40 ft (approx.) Monitoring Well Soil Boring Garage Residence exceeds criteria below criteria Apartments Case Example 56 Step 1: Define Problem and Assess Uncertainties 1. Uncertain plume delineation; no down-gradient control 2. Source area inferred, not confirmed 3. No remedy evaluation 4. No soil gas or VI assessment Groundwater Plume Area N Garage Dry Cleaner Gasoline Station Garage Garage Vacant Garage Residence 40 ft (approx.) Monitoring Well Soil Boring Garage Residence exceeds criteria below criteria Apartments 57 Step 2: Identify Data Needs & Spatial Resolution Translate uncertainties into data needs Determine resolution needed to assess controlling heterogeneities 58 Step 2: Identify Data Needs & Spatial Resolution Additional groundwater samples needed to define plume extent Case Example N Garage Dry Cleaner Gasoline Station Garage Additional soil samples Garage needed to confirm source area Vacant Garage Residence Apartments 40 ft (approx.) Monitoring Well Soil Boring Garage Residence Soil-gas samples needed to assessment VI threat exceeds criteria below criteria 59 Step 2: Identify Data Needs & Spatial Resolution N Garage Dry Cleaner Gasoline Station Case Example Garag e Garage Vacant Garage Residence 40 ft (approx.) Depth (ft) Monitoring Well Soil Boring Garage Residence 20 exceeds criteria below criteria Original vertically-delineated plume 0 10 Apartments ?? Uncertain vertical delineation in source area 60 Step 3: Establish Data Collection Objectives Specific, Clear, Actionable Consider data types, quality, density, and resolution 61 Step 3: Example Data Collection Objectives Delineate extent of dissolved-phase plume; determine stability and attenuation rate Grab groundwater samples at X and Y depths Soil borings every X feet to capture subsurface variability Delineate to drinking water standards Install three to five wells; monitor along axis of flow • Quarterly for two years • Evaluate C vs T and C vs. distance trends • Specify COCs and geochemical parameters 62 Poll Question Poll Question Have you ever collected data types that were not optimal for deciding what to do next? • Yes • No 63 Step 3: Drycleaner Site Data Collection Objectives Case Example Objectives • • • • Define plume extent exceeding standards Assess remedy progress – soil and GW samples Assess shallow soil vapor & VI threat Streamline assessment – days not weeks Data types & resolution • Continuous cores; samples at lithologic boundaries • Groundwater samples every 4’ • Soil gas at 5 and 10 feet 64 Step 4: Data Collection & Analysis Plan Write work plan • Recognize data limitations • Select data management tool • Develop data analysis process Consider real-time analysis Screening Method • Qualitative tools • Direct subsequent data collection Fill in the Gaps • Contaminant flux • Horizontal and vertical resolution vital Map Extent • Delineate source • Decision making Case Example 65 Step 4: Drycleaner Site Data Collection & Analysis Plan Soil vapor sampling Triad ES mobile lab and Geoprobe Direct sampling ion trap mass spectrometry (SW846 Method 8265) with mobile lab provides up to 80 soil/groundwater and 60 soil vapor VOC analyses per day 66 Step 4: Data Collection & Analysis Plan Updated Groundwater Plume Area Case Example 16 borings 80 soil samples (~5 per boring) 48 grab groundwater samples (~3 per boring) Soil sampling to confirm source area N Garage Dry Cleaner Gasoline Station Garage Garage Vacant Garage Residence Apartments 40 ft (approx.) Monitoring Well Soil Boring Garage GW sampling to better define plume extent to southeast Residence Proposed sample location exceeds criteria below criteria 67 Step 4: Data Collection & Analysis Plan Shallow soil vapor results Case Example Soil gas • 12 points • 24 samples N Garage Dry Cleaner Gasoline Station Garage Garage Vacant Garage Residence Apartments 40 ft (approx.) Monitoring Well Soil Boring Garage Residence Soil-gas samples needed to assessment VI threat Proposed soil-gas sample location 68 Summary – Integrated Site Characterization Integrated Site Characterization flow chart • Planning • Tool Selection • Implementation Planning module • • • • • Step 1: Define problem and uncertainties Step 2: Identify data gaps & resolution Step 3: Develop data collection objectives Step 4: Design data collection & analysis plan Similar to DQO process; focus on DNAPL sites 69 Training Overview DNAPL Characteristics Life Cycle of a DNAPL Site Integrated Site Characterization • Plan • Tools Selection • Implementation Summary ISC-1, Chapter 4 70 Tools Selection Process: Contents of this Section Orientation to the tools matrix Tools selection framework Tools matrix functionality Case studies Summary 71 Poll Question Poll Question Which of these tools have been used on your sites? Check all that apply. • Split Spoon Sampler • Hydraulic Profiling Tool • Membrane Interface Probe • Portable GC/MS • Colorimetric Screening • Electrical Resistivity Tomography • Raman Spectroscopy • Fluorescence In-situ Hybridization (FISH) • Partitioning Interwell Tracer Test (PITT) 72 Tools Matrix Format and Location The tools matrix is a downloadable excel spreadsheet located in Section 4.6 Tools segregated into categories and subcategories, selected by subject matter experts A living resource intended to be updated periodically Tool Geophysics Surface Geophysics Downhole Testing Hydraulic Testing Single well tests Cross Borehole Testing Vapor and Soil Gas Sampling Solid Media Sampling and Analysis Methods Solid Media Sampling Methods Solid Media Evaluation and Testing Methods Direct Push Logging (In-Situ) Discrete Groundwater Sampling & Profiling Multilevel sampling DNAPL Presence Chemical Screening Environmental Molecular Diagnostics Microbial Diagnostics Stable Isotope and Environmental Tracers On-site Analytical 73 Orientation to the Tools Matrix Contains over 100 tools Sorted by: • Characterization objective Geology Hydrogeology Chemistry • Effectiveness in media Unconsolidated/Bedrock Unsaturated/Saturated Ranked by data quality • Quantitative • Semi-quantitative • Qualitative 74 Tools Matrix Functionality Click any box for a description or definition Click 75 Detailed Tool Descriptions (Appendix D) Click on any tool Additional reference material Description Applicability Limitations Click 76 Shaded Boxes Denote Tool Meets Objective Tools collect these types of information Green shading indicates that tool is applicable to characterization objective 77 Using the Tools Matrix Down-selecting appropriate tools to meet your characterization objectives A systematic process • Select your categories: geology, hydrogeology, chemistry • Select parameters of interest • Identify geologic media (e.g., unconsolidated, bedrock) • Select saturated or unsaturated zone • Choose data quality (quantitative, semi-quantitative, qualitative) • Apply filters, evaluate tools for effectiveness, availability, and cost Ultimately, final tools selection is site-specific, dependent upon team experience, availability, and cost 78 1. Select Category All Geology Hydrogeology Chemistry – All – Soil Gas – Groundwater – Solid Media 79 2. Select Parameters of Interest All Lithology Contacts Porosity Permeability Dual Permeability Faults Fractures Fracture Density Fracture Sets Rock Competence Mineralogy 80 3. Identify Geologic Media All Bedrock Unconsolidated 81 4. Identify Zone All Unsaturated Saturated 82 5. Choose Data Quality (Q) quantitative (SQ) semiquantitative (QL) qualitative 83 6. Apply Filters, Evaluate Tools Click 84 Perform Additional Searches to Find More Tools for Different Objectives Additional parameters can be added or removed from any given search 85 Add Parameters to a previous search Multiple searches can be saved on one matrix 86 Apply Selected Tool(s) Incorporate selected tool(s) into characterization plan Implement plan, evaluate data, update CSM, reassess characterization objectives Repeat tool selection process as necessary 87 Case Example – Characterization Objectives Returning to Case Example from prior section – Characterization Objective: Delineate lateral and vertical extent of dissolvedphase plume; determine stability and rate of attenuation. Goal: Define boundary exceeding groundwater standards Assess remedy progress – soil and groundwater samples Assess shallow soil vapor impacts Case Example 88 Case Example – Select Tools Matrix Filters Filters Type • Chemistry - All Case Example Parameter • Contaminant Concentration Subsurface Media • Unconsolidated Subsurface Zone • All Data Quality • (Q) Quantitative 89 Case Example Case Example – Apply Filters 90 Case Example Case Example – Applicable Tools 91 Case Example – Tools Selection Case Example Search returns 22 tools Considering desire to expedite the assessment, project team selected • Direct Push borings with continuous soil sampling and GW grab sampling on 4-foot intervals • Active Soil Gas Survey at two depth intervals • Direct Sampling Ion Trap Mass Spectrometer (DSITMS) mobile field lab Active Soil Gas Survey DSITMS Mobil Lab 92 Example #2 Characterization Objective – Determine the porosity of a fractured bedrock formation in a DNAPL source zone to evaluate the potential storage capacity of the rock Type • Geology Parameter • Porosity Subsurface Media • Bedrock Subsurface Zone • Saturated Data Quality • (Q) Qualitative 93 Example #2 – Bedrock Porosity Over 100 tools distilled to 10 that are applicable to the Characterization Objective 94 Example #3 Characterization Objective – Evaluate potential matrix diffusion issues associated with variations in hydraulic conductivity Type • Hydrogeology Parameter • Hydraulic Conductivity Subsurface Media • Unconsolidated Subsurface Zone • Saturated Data Quality • All 95 Example #3 – Hydraulic Conductivity 21 tools returned. Can we refine? 96 Example #3 – Hydraulic Conductivity (refined) Change data quality to QL 7 tools returned 97 ITRC Tools Matrix Summary Characterization objectives guide selection of tools Interactive tools matrix - over 100 tools with links to detailed descriptions A systematic tools selection process Select tools, implement work plan, evaluate results Align data gaps with characterization objectives, update CSM Repeat as necessary until consensus that objectives have been met 98 Training Overview DNAPL Characteristics Life Cycle of a DNAPL Site Integrated Site Characterization • Plan • Tools Selection • Implementation Summary ISC-1, Chapter 4 99 Conducting Step 6: Implement investigation Step 7: Perform data evaluation and interpretation Step 8: Update CSM 100 Step 6. Implement Investigation Time to conduct the investigation • Go into field • Use flexible plan • Collect data Often concurrent with data evaluation (Step 7) 101 Step 7. Data Evaluation and Interpretation Gain understanding of site • Integrate all data types • Generate collaborative datasets Multiple line of evidence • Contaminant transport • Storage • Attenuation 102 Step 7. Soil and Groundwater Data Evaluation and Interpretation Case Example Source area concentrations remain elevated Garage Dry Cleaner N Depth PCE mg/kg Lab 0-2 3.25 Mobile 2-4 2.232 Mobile 4-6 <0.37 Mobile 3.298 Mobile 11.5 Mobile 10-12 <0.37 Mobile 0-2’ 21 Fixed Gasoline Station Garage Garage Vacant Garage 6-8 Residence 40 ft (approx.) Monitoring Well Soil Boring Garage 8-10 Apartments Residence Result exceeds criteria Result does not exceed criteria 103 Step 7. Soil Vapor Data Evaluation and Interpretation Case Example N Garage Dry Cleaner Depth PCE units Lab 3-4’ 3720 Mobile 4-5’ 2398 Mobile 4-5’ 3800 Fixed Gasoline Station Garage Garage Vacant Garage Residence Apartments 40 ft (approx.) Monitoring Well Soil Boring Garage Shallow soil vapor results Residence Result below vapor screening level Result exceeds chronic vapor screening level Result exceeds sub-chronic vapor screening level 104 Poll Question Poll Question When do you typically update your CSM at sites where you work? • Whenever new data is • • • • collected When a remedial technology fails Whenever the CSM is determined to be inaccurate Every five years Never 105 Step 8. Update the CSM Data collected from all phases of a project can be used As a project progresses, data needs shift In late phases, additional data collection often driven by specific questions ISC continues as the CSM evolves 106 Step 8: Dry Cleaners – CSM Update < vapor screening level > chronic vapor screening level > sub-chronic vapor screening level N Garage Dry Cleaner Gasoline Station Case Example Garag e Garage > soil/GW criteria < soil/GW criteria Vacant Garage Residence Apartments 40 ft (approx.) Depth (ft) Monitoring Well Soil Boring 0 10 20 Garage Residence Original vertically-delineated plume With additional data, the source area was found to extend west further than previously delineated 107 Integrated Site Characterization Benefits for Dry Cleaners Sites Case Example Confirmed need for residential indoor air evaluation and VI mitigation for commercial buildings Optimized data density in specific areas; avoided unnecessary / inconclusive data collection Accurately determined source zone and remediation target area Completed ahead of schedule; saved $50k of $150k budget (33%) 108 Training Overview DNAPL Characteristics Life Cycle of a DNAPL Site Integrated Site Characterization • Plan • Tools Selection • Implementation Summary 109 Summary Integrated Site Characterization Planning Tools selection Implementation 110 Integrated Site Characterization is the Path Forward Too many DNAPL sites are stalled or unresolved Examining DNAPL mobility in heterogeneous environments promoted better remedy selection Better characterization builds trust and confidence in site decisions 111 Thank You for Participating 2nd question and answer break Links to additional resources Poll Question • http://www.clu-in.org/conf/itrc/IDSC/resource.cfm Feedback form – please complete • http://www.clu-in.org/conf/itrc/IDSC/feedback.cfm Need confirmation of your participation today? Fill out the feedback form and check box for confirmation email and certificate.
