pH Titrations with LabQuest
advertisement
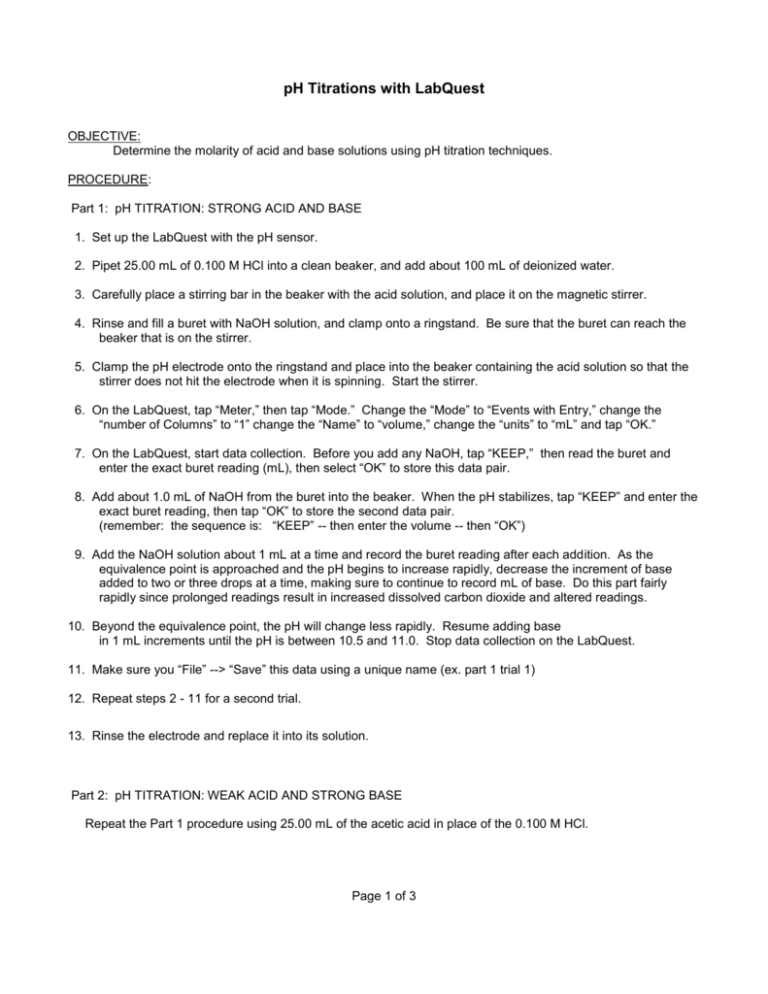
pH Titrations with LabQuest OBJECTIVE: Determine the molarity of acid and base solutions using pH titration techniques. PROCEDURE: Part 1: pH TITRATION: STRONG ACID AND BASE 1. Set up the LabQuest with the pH sensor. 2. Pipet 25.00 mL of 0.100 M HCl into a clean beaker, and add about 100 mL of deionized water. 3. Carefully place a stirring bar in the beaker with the acid solution, and place it on the magnetic stirrer. 4. Rinse and fill a buret with NaOH solution, and clamp onto a ringstand. Be sure that the buret can reach the beaker that is on the stirrer. 5. Clamp the pH electrode onto the ringstand and place into the beaker containing the acid solution so that the stirrer does not hit the electrode when it is spinning. Start the stirrer. 6. On the LabQuest, tap “Meter,” then tap “Mode.” Change the “Mode” to “Events with Entry,” change the “number of Columns” to “1” change the “Name” to “volume,” change the “units” to “mL” and tap “OK.” 7. On the LabQuest, start data collection. Before you add any NaOH, tap “KEEP,” then read the buret and enter the exact buret reading (mL), then select “OK” to store this data pair. 8. Add about 1.0 mL of NaOH from the buret into the beaker. When the pH stabilizes, tap “KEEP” and enter the exact buret reading, then tap “OK” to store the second data pair. (remember: the sequence is: “KEEP” -- then enter the volume -- then “OK”) 9. Add the NaOH solution about 1 mL at a time and record the buret reading after each addition. As the equivalence point is approached and the pH begins to increase rapidly, decrease the increment of base added to two or three drops at a time, making sure to continue to record mL of base. Do this part fairly rapidly since prolonged readings result in increased dissolved carbon dioxide and altered readings. 10. Beyond the equivalence point, the pH will change less rapidly. Resume adding base in 1 mL increments until the pH is between 10.5 and 11.0. Stop data collection on the LabQuest. 11. Make sure you “File” --> “Save” this data using a unique name (ex. part 1 trial 1) 12. Repeat steps 2 - 11 for a second trial. 13. Rinse the electrode and replace it into its solution. Part 2: pH TITRATION: WEAK ACID AND STRONG BASE Repeat the Part 1 procedure using 25.00 mL of the acetic acid in place of the 0.100 M HCl. Page 1 of 3 GRAPHICAL ANALYSIS Take the LabQuest to a computer, and import the data into LoggerPro. 1. Make and print the following graphs for Part 1: a. pH vs. mL added for trial 1 b. pH vs. mL added for trial 2 c. DpH/DmL vs. mL for the best of your two trials. 2. Using the first derivative graph (c) interpolate the exact volume of base added at the endpoint. Using a pen, record this value in large, bold numbers in the upper right corner of your graph. 3. Make and print the following graphs for Part 2: a. pH vs. mL added for trial 1 b. pH vs. mL added for trial 2 c. DpH/DmL vs. mL for the best of your two trials. 4. Using the first derivative graph (c), interpolate the exact volume of base added at the endpoint. Using a pen, record this value in large, bold numbers in the upper right corner of your graph. CALCULATIONS and QUESTIONS: 1. Using your endpoint data from Part 1, graph c, calculate the concentration of the NaOH. 2. Using your endpoint data from Part 2, graph c, calculate the concentration of the acetic acid. 3. Calculate the Ka for the weak acid. Remember: pKa = pH when the volume of the base added is one-half of the amount at the equivalence point. 4. What advantage(s) does this method have over titrating with phenolphthalein? Page 2 of 3 Classroom usage: This experiment would be appropriate for students in Chemistry or AP Chemistry. Curriculum Integration with Indiana’s Academic Standards: Students can gain an undertstanding of the Standards by using instrumentation, technology, and sensors to investigate physical, chemical, and environmental factors. Chemistry some matching Standards are: C 1.2, C. 1.4, C. 1.5, C. 1.7, C. 1.8, C. 1.11, c.1 29, C. 1.35, C. 1.36 Biology some matching Standards are: B.1.2, B. 1.3, B. 1.4, B. 1.5, B. 1.6, B. 1.7, B. 1.8, B. 1.9, B. 1.10, B. 1.24, B. 1.27 B. 1.37, B. 1.40, B. 1.41, B. 1.42, B. 1.43, B. 1.44, B. 1.45 LabQuest with pH meter sensor Gregg Beck Debra Beck 6/2009 Page 3 of 3 B. 1.39,
