Receptor Theory: Evaluating my therapeutic? Goals and Objectives
advertisement
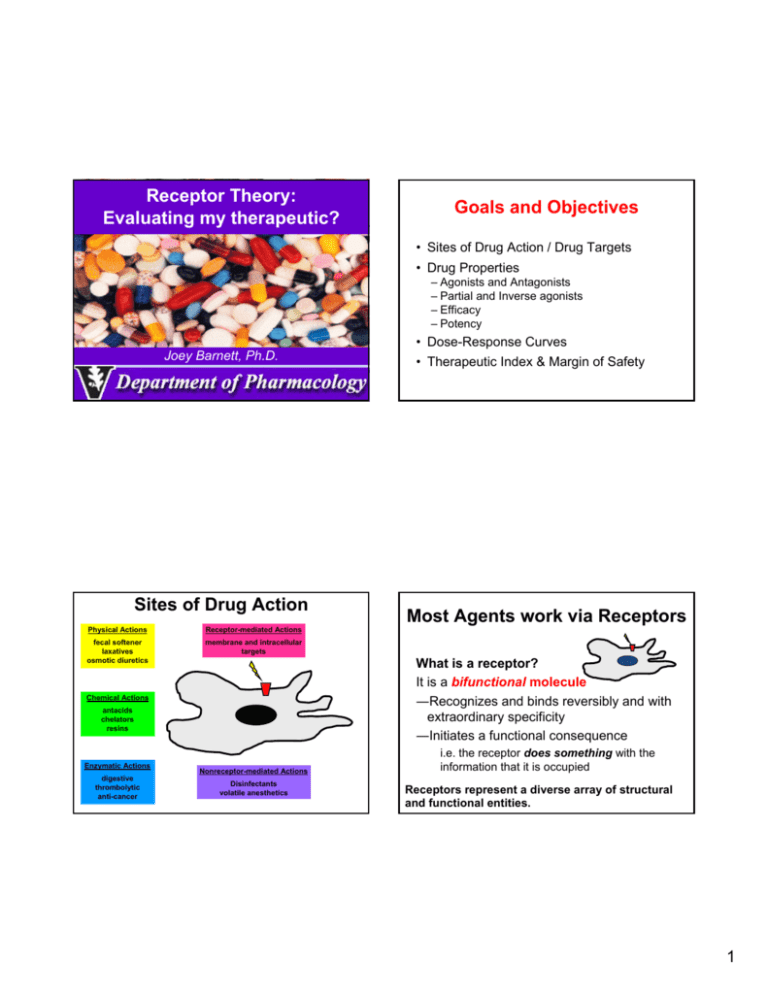
Receptor Theory: Evaluating my therapeutic? Goals and Objectives • Sites of Drug Action / Drug Targets • Drug Properties – Agonists and Antagonists – Partial and Inverse agonists – Efficacy – Potency • Dose-Response Curves Joey Barnett, Ph.D. Sites of Drug Action Physical Actions Receptor-mediated Actions fecal softener laxatives osmotic diuretics membrane and intracellular targets Chemical Actions antacids chelators resins Enzymatic Actions digestive thrombolytic anti-cancer Nonreceptor-mediated Actions Disinfectants volatile anesthetics • Therapeutic Index & Margin of Safety Most Agents work via Receptors What is a receptor? It is a bifunctional molecule ―Recognizes and binds reversibly and with extraordinary specificity ―Initiates a functional consequence i.e. the receptor does something with the information that it is occupied Receptors represent a diverse array of structural and functional entities. 1 Definitions Receptor Theory 101 Agonist Drug which binds to the same receptor as the endogenous compound and produces the same type of signal as the endogenous hormone/neurotransmitter. Enzyme Kinetics: Antagonist Drug which binds to the same receptor as the endogenous compound and inhibits the signal produced by the activating hormone/neurotransmitter. Substrate (S) + enzyme (E) Partial Agonist Drug which when maximally bound to the receptor causes a sub-maximal response. Inverse Agonist (Negative Antagonist) Drugs which cause a decrease in basal receptor activity i.e. in the absence of agonist. Affinity A measure of the strength of interaction between a receptor and its cognate ligand; KD is defined as the concentration at which half of the receptor is occupied. Efficacy A measure of the efficiency in which a bound ligand activates its target receptor’s signal transduction/biological response. ES → E + Product (P) Agonist (A) + Receptor (R) AR →→ effects Agonist is a Drug that elicits a biological effect. The agonist does not get modified, or changed, by interaction with the receptor Potency An overall measure of the ability of a ligand to activate its target receptor. Related to the EC50 ;the concentration at which a half maximal effect is achieved. Clark - ”Simple Occupation Theory” Assumptions of A. J. Clark: Law of Mass Action k1 D+R DR k2 k 2 [D][R] KD = = [DR] k1 D = drug R = receptor DR = receptor/drug complex R + DR = RTOT k1 = on rate k2 = off rate KD equilibrium dissociation constant KD = k2 / k1 units are M KA equilibrium association constant KA = k1 / k2 units are M-1 KD = 1/ KA Responses to drugs result from formation of reversible complexes with receptors. One molecule of drug occupies one receptor. The response to a drug is proportional to the number of receptors occupied.* A maximum response to a drug occurs when all receptors are occupied (clearly not always true).* The total amount of drug bound to receptors is negligible relative to the total amount of drug present. The concentration of DR is affected by both [D] and [R]! Therefore receptor density will affect the dose response. The more receptors are present, the more leftward shifted will be the dose response curve. 2 Two of Clark’s assumptions do not hold Receptor‐mediated effects demonstrate a graded dose‐response relationship Percent Maximal Response Spare Receptors A B 100 100 50 50 0 0 EC50 [A] Log [A] A maximum response to a drug occurs when all receptors are occupied (clearly not always true).* Graded Dose Response Curve The response to a drug is proportional to the number of receptors occupied.* Threshold, Slope, and Maxima Depiction of agonist receptor interaction response = ƒ[agonist][receptor]KA•e where KA = equilibrium affinity constant and e = efficiency of receptor-effector coupling leading to biological response In various diseases response is observed. a change in Classic endocrine disorders: due to a change in agonist availability Change in KA = consequence of receptor mutations, post-translational modifications (especially phosphorylation) Changes in e = typically due to post-translational modifications mediated by downstream kinases, phosphatases, or changes in expression levels of downstream proteins Changes in R = mutation; perturbation of expression or turnover by other biological processes (20-80% is essentially linear) Key Concepts Receptor activation can be described with mathematical models. Receptor activation is not linear with ligand binding. Usually relatively low receptor occupancy is required to elicit relatively high response. I.e., 25% activation takes place at less than 25% occupancy. Receptor mediated activity is affected by the inherent properties of the ligand, the number of receptors present and the characteristics of the signal transduction machinery. Numerous biological processes reflect changes in signal transduction with development, disease, aging, etc., it has been necessary to obtain quantitative data on RECEPTOR OCCUPANCY and SIGNALING EFFICIENCY 3 Definitions of therapeutic drugs What dose response curves look like for these various types of drugs…. 1. Agonists ‐ “doer” drugs ‐ Mimic the actions of endogenous agents ‐ Activate receptors ‐ Both “full” and partial agonists 200 150 Simple Model D●Ri D●Ra antagonist 100 Classically, have no effect of their own, other than to block the receptors, so agonists can’t bind ( null, competitive antagonists) ….but there are other antagonist mechanisms that we now understand Ra partial agonist Level of Response (arbitrary units) 2. Antagonists‐ Blocker drugs Ri agonist 50 inverse agonist Log [Drug] Quantifying Drug Effects D + R DR → → effect 200 agonist 150 Level of Response (arbitrary units) 100 Ra >>>Ri partial agonist Ra >Ri antagonist Ra=Ri 50 inverse agonist Ri >>>Ra 1 2 1) Affinity – describes “tightness” of interaction between a receptor and drug 2) Efficacy – describes the “strength” or “extent” of the pharmacological effect 3) Potency – in clinical settings, reflects both 1 and 2. Log [Drug] 4 Potency & Efficacy Potency & Efficacy Potency Potency Efficacy EC50 Potency & Efficacy Driving home the difference between potency and efficacy B Efficacy Response A D Log [Drug] C Equal efficacy - curves A & B Equal efficacy - curves C & D Equal potency – curves A & D curves B & C 5 [Response] Relationships Define Receptor Specificity Maximal effect Decreasing Potency Decreasing Potency 100 100 50 50 op e variability sl Intensity of effect Variability among individuals manifests itself in multiple aspects of dose‐response curves potency EC50 Log [Agonist] EC50 Log [Agonist] concentration Fixed dose-varying magnitudes Varying doses required to get a specific response Smooth Muscle Contraction Cardiac Chronotropy & Inotropy 100 100 Percent Maximal Response Percent Maximal Response Alpha- & Beta-adrenergic receptors: Ahlquist’s landmark hypothesis of a single Mediator with two receptors 50 Blood Pressure Effects 50 NE EPI ISO Iso EPI NE Log [Agonist] Log [Agonist] 6 Which agonists act at the same site? Irreversible Blockade Estimation of Dissociation Constants of Agonists For the following derivations and approach, the following assumptions are made: the agonist elicits a response of only one type in the preparation and by the reacting with only one type of receptor. the population of this type of receptor is uniform with respect to KD both before and after the irreversible inactivation of a fraction of the receptors, E is the same function of S and S has the same relationship to [DR]. When E is measured, [D] is essentially equal in the region of receptors and in the bathing medium (no accessibility problems). A negligible fraction of D is bound to receptors. When E is measured, a steady state exists which is governed by mass action law relating to [DR] / [Rt] to [D] and Kd. there is no desensitization of R after interaction and dissociation with D. Inactivation of receptors by an agent such as dibenamine is completely irreversible for all practical purposes. Using dibenamine as an irreversible blocking agent, in rabbit aortic strips, Furchgott demonstrated that in rabbit aortic strips, cross-protection occurred among epinephrine (epi), norepinephrine (norepi) and isoproterenol (iso). This was taken as evidence that they all acted on the same receptor. None of the catecholamines (epi, norepi, iso) protected against inactivation of receptors for histamine, acetylcholine or serotonin, and none of the latter protect among themselves or towards catecholamines. Stephenson’s concept of spare receptors is essential to understanding the approach, as is the use of irreversible receptor antagonists to demonstrate the existence of spare receptors. Based on these findings, Furchgott deduced the existence of four receptor subtypes in rabbit aorta, all of which could mediate contraction. Furchgott conceptualized protection experiments as either “self protection” or “cross protection”: ⎛ DR ⎞ E = f (S) = f ⎜e ⎟ ⎝ RTOT ⎠ E max When spare receptors are present, a straightforward determination of KD by equating it with EC50 is impossible. If only a small fraction of receptors must be occupied to produce a maximum response, the EC50 will be less than KD. The approach of Stephenson and Furchgott is to inactivate a fraction of the receptors with an irreversible antagonist and then to mathematically treat dose response curves before and after receptor inactivation to estimate both KD and the fraction of receptors inactivated (or remaining activated). See Furchgott, R., J Pharm Exper Ther 111:265, 1954. Estimation of Dissociation Constants of Agonists Receptor classification by antagonists Classification of receptors by antagonists is perhaps the most common method for receptor classification Determination of antagonist KD on tissues Schild Analysis of Antagonist binding. General Principles Competitive antagonist acting on the same receptor will have the same KD regardless of the agonist which is displaced. D' 1 D' (1 − q) = + D q KD * q or D D' =q D + KD D' +KD Identical receptors in different tissues or experimental preparations should display the same dissociation constant for the same competitive antagonist. Theory/Calculations This is for strictly competitive, reversible antagonists. The ability to shift the dose-response curve is influenced by the antagonist affinity (KDB) for the receptor and the antagonist concentration ([B]). 7 Schlid Analysis Antagonists – Competitive pA2 = -logKDB Non-competitive Antagonists also exist Most common pharmacological antagonists are competitive antagonists Non-competitive antagonism also can be due to allosteric effects • Non-competitive antagonism can be due to pseudo-irreversibility of antagonist binding 8 Allosteric Modifiers can also potentiate,or sensitize, the response Quantal Response Curves Therapeutic Index describes relationship desired biological effect and toxicity • Dose-dependent • Therapeutic ratio or index – Toxic (Lethal) dose50 Effective dose50 • Margin of safety – Toxic (Lethal) dose1 Effective dose99 • Ratios less helpful when non- parallel curves 80 • Used when not able to do full dose‐response curve Cumulative Frequency Distribution 60 40 Frequency Distribution • Y axis can be 20 5 7 10 – Cumulative response or – Frequency distribution 20 Concentration (mg/ml) Therapeutic Index versus Margin of Safety Percent of Subjects responding Note the opportunity for drug effect at very low [agonist/endogenous agent] when a Positive allosteric modifier is present Number Responding 100 100 100 Drug A Therapeutic Toxic Therapeutic Toxic 50 50 0 Drug B 1 3 10 30 100 0 1 3 10 30 100 300 Dose-log scale Therapeutic Index = Margin of Safety = toxic dose 50 therapeutic dose50 toxic dose 1 therapeutic dose99 9 References Cell Surface Receptors: a short course on theory and methods. Lee Limbird, Springer, Third edition 2004 Receptor Theory: Evaluating my therapeutic? Goodman and Gilman: The Pharmacological Basis of Therapeutics. Chapter 2-Mechanisms of Drug Action and Relationship between Drug Concentration and Effect. EM Ross & TP Kenakin. Hardman and Limbird, eds. 10th edition, 2001. Joey Barnett, Ph.D. 10
