Flow out of concrete filter - Springer Static Content Server
advertisement

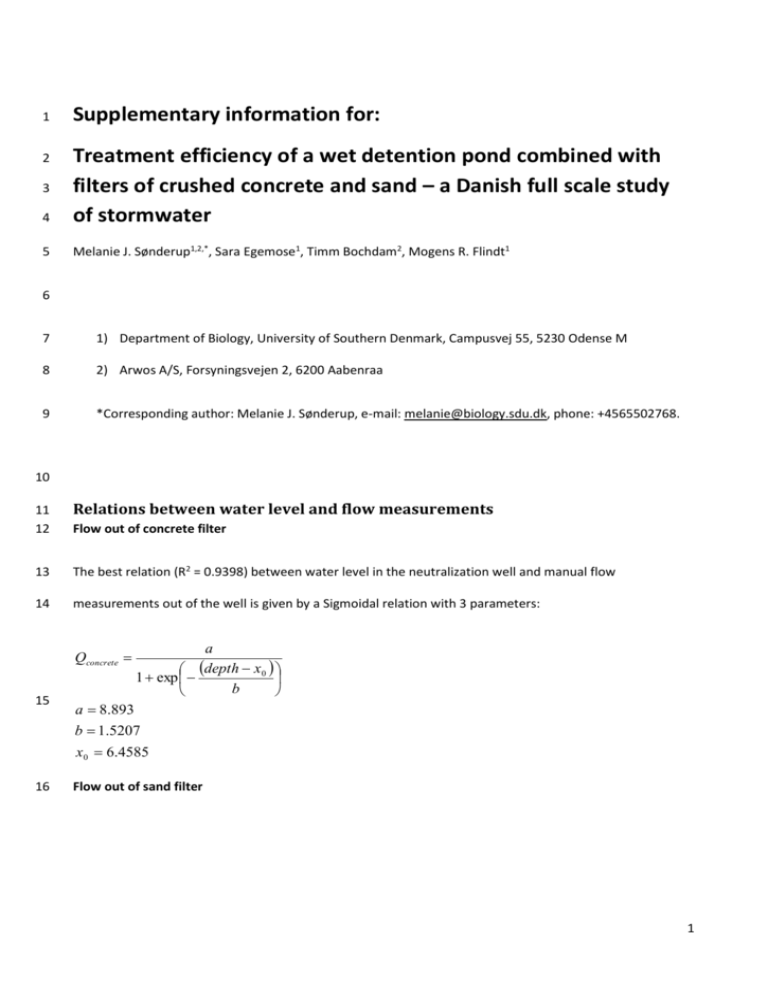
1 Supplementary information for: 2 4 Treatment efficiency of a wet detention pond combined with filters of crushed concrete and sand – a Danish full scale study of stormwater 5 Melanie J. Sønderup1,2,*, Sara Egemose1, Timm Bochdam2, Mogens R. Flindt1 3 6 7 1) Department of Biology, University of Southern Denmark, Campusvej 55, 5230 Odense M 8 2) Arwos A/S, Forsyningsvejen 2, 6200 Aabenraa 9 *Corresponding author: Melanie J. Sønderup, e-mail: melanie@biology.sdu.dk, phone: +4565502768. 10 11 12 Relations between water level and flow measurements 13 The best relation (R2 = 0.9398) between water level in the neutralization well and manual flow 14 measurements out of the well is given by a Sigmoidal relation with 3 parameters: Flow out of concrete filter Qconcrete 15 a depth x 0 1 exp b a 8.893 b 1.5207 x 0 6.4585 16 Flow out of sand filter 1 17 There is a strong linear correlation (R2 = 0.9843) between the flow (manual measurements) out of the 18 concrete filter and the relation between flow (manual measurements) out of the concrete filter and the 19 sand filter (in percentage): Qconcrete 100% a Qconcrete b Qsand 20 a 9.4705 b 91.5352 21 This means that the flow out of the sand filter is almost identical (0.8 L s-1 or 82 %) to the flow out of 22 concrete filter at low flow (1 L s-1), whereas the difference is far more pronounced at high flow out of the 23 concrete filter (8 L s-1) compared to the sand filter (1.3 L s-1 or 16 %). 24 Flow out of the pond and into both filters 25 Water level loggers placed in both filters measured water level changes, which are then calculated into 26 volume changes from the known surface area and bank slopes. As the system operates by mass 27 conservation, the inlet flow to the filters is calculated from addition of the outlet flow and the volume 28 change over time. The calculated flow was validated by manual flow measurements. 29 Overflow from the pond 30 Overflow occurs whenever the water level in the pond reaches the overflow level, which is a 1.25 m long 31 wall inside the outlet well. The water level in the pond was measured by a logger placed in the outlet well. 32 The overflow is calculated from free fall and kinetic/potential energy, whenever the water level reaches the 33 overflow level: E pot E kin ; where E pot m g h and 34 E kin 0.5 m v 2 g h 2 Qoverflow v l overflow actual water depth overflow level v 2 35 Flow into the pond 36 The water level logger placed in the outlet well from the pond measured water level changes in the pond, 37 which is then calculated into volume changes from the known surface area and bank slopes. As the system 38 operates by mass conservation, the inlet flow to the pond is calculated from addition of the outlet flow, the 39 overflow and the volume change over time. The calculated flow was validated by manual flow 40 measurements. 41 Flow in and out of the oil separator 42 The oil separator is only in use, when the water level in the grit chamber reaches a certain level. The 43 relation between manual flow measurements out of the oil separator (3.0-4.5 L s-1) and water level in the 44 grit chamber is described by a linear regression: Qoil separator a depthgrit chamber b 45 a 0.0223 b 1.1961 46 Flow into the grit chamber (runoff from catchment) 47 As the system operates by mass conservation, the inlet flow to the grit chamber is calculated from addition 48 of the flow into the pond and oil separator. The calculated flow was validated by manual flow 49 measurements. Runoff from the catchment was compared to precipitation data from a local rain gauge, to 50 separate the inlet flow into precipitation and additional sources like groundwater. 51 3 52 Tables and figures 53 Table S1: 54 Linear correlations between precipitation (amount and duration) and retention of SS, PP and TDP in % (n = 55 5). The table contains the equation for the linear correlation, the R2 value for the regression line and the p- 56 value for the linear regression. Precipitation Amount [mm] Duration [h] Parameter SS PP TDP SS PP TDP SS % PP % TDP % SS % PP % TDP % Equation = 105.130 - (3.542 * mm) = 105.869 - (4.734 * mm) = 101.475 - (3.199 * mm) = 91.059 - (1.956 * h) = 86.540 - (2.558 * h) = 84.196 - (1.272 * h) R2 0.814 0.815 0.636 0.992 0.951 0.402 p-value 0.036 0.036 0.106 <0.001 0.005 0.251 57 58 Figure S1: 59 Measured pH values from March 2013 to March 2014 in outlet from the pond = inlet to the filters, outlet 60 from the concrete filter before and after neutralization and pH in the receiving water. Horizontal lines 61 indicate periods without measurements. Neutralization was stopped after 210 days. 62 4


