Casio fx-82AU PLUS-Statistics
advertisement
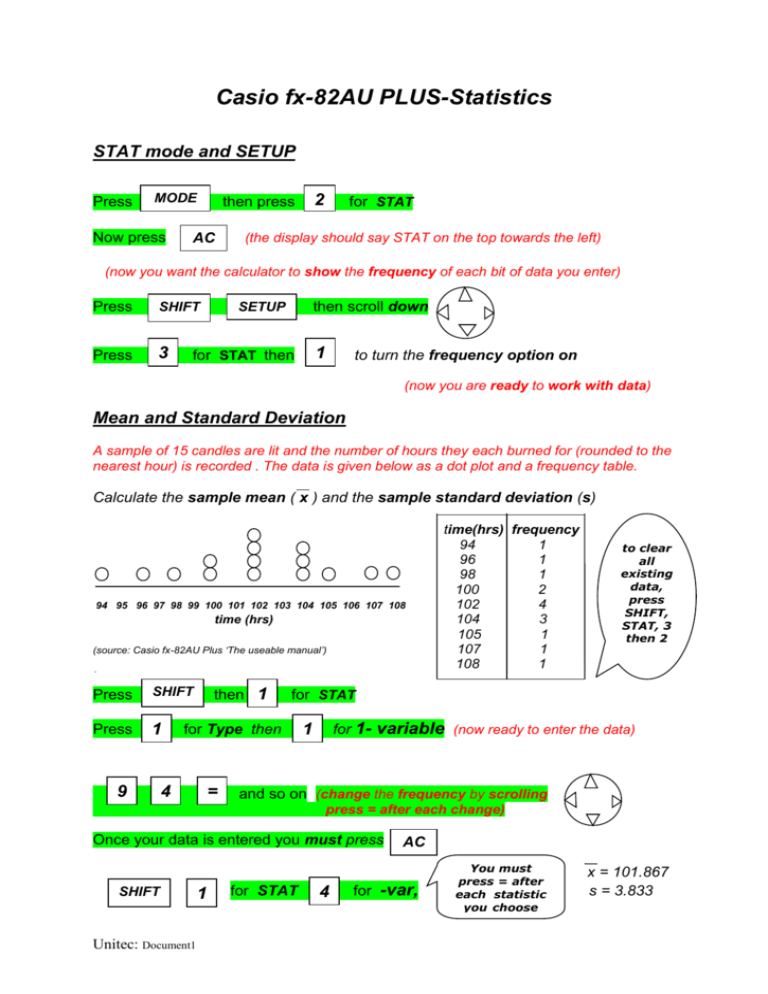
Casio fx-82AU PLUS-Statistics STAT mode and SETUP Press MODE Now press 2 then press AC for STAT (the display should say STAT on the top towards the left) (now you want the calculator to show the frequency of each bit of data you enter) Press SHIFT Press 3 then scroll down SETUP 1 for STAT then to turn the frequency option on (now you are ready to work with data) Mean and Standard Deviation A sample of 15 candles are lit and the number of hours they each burned for (rounded to the nearest hour) is recorded . The data is given below as a dot plot and a frequency table. Calculate the sample mean ( x ) and the sample standard deviation (s) 94 95 96 97 98 99 100 101 102 103 104 105 106 107 108 time (hrs) (source: Casio fx-82AU Plus ‘The useable manual’) Press SHIFT Press 1 9 then 1 = to clear all existing data, press SHIFT, STAT, 3 then 2 for STAT for Type then 4 time(hrs) frequency 94 1 96 1 98 1 100 2 102 4 104 3 105 1 107 1 108 1 for 1- variable (now ready to enter the data) 1 and so on (change the frequency by scrolling press = after each change) Once your data is entered you must press SHIFT Unitec: Document1 1 for STAT 4 AC for -var, You must press = after each statistic you choose x = 101.867 s = 3.833 Linear Regression The table below shows the number of non-Holden cars (N thousands) assembled each year from 1948 to 1959 (yr 1 represents 1948) year 1 N (000) 2 3 4 5 6 7 8 9 10 11 12 25.2 22.2 23.9 20.3 15.4 14.4 19.3 20.6 15.1 10.9 13.8 13.2 (a) Find the equation of the least square regression line (i.e.find slope & yintercept (b) If the trend continued, use the equation to predict the number of non-Holden cars that would have been assembled in 1974. (source: Casio fx-82AU Plus ‘The useable manual’) Press 2 MODE then choose 2 for the A + BX option AC Enter the data, once entered and checked press SHIFT 5 STAT (remember to press = after each bit of data) for Regression The values are: A – the y-intercept of the least square regression line B – the slope of the least square line r – correlation coefficient x – the predicted vale of x given a value of y y – the predicted value of y given a value of x 1 = for A (24.770) 2 = for B (-1.063) equation is: Y = A + BX written in full : (predicted number of non-Holden ) = 24.770 – 1.063 x (year) cars assembled N (000) When the year is 1974 (i.e. x = 27) find y Press AC 27 SHIFT STAT Then 5 for y Unitec: Document1 = 5 for Reg (-3.939 thousands) guess the trend didn’t continue!

