Lab 12: UV-Vis and Fluorescence
advertisement
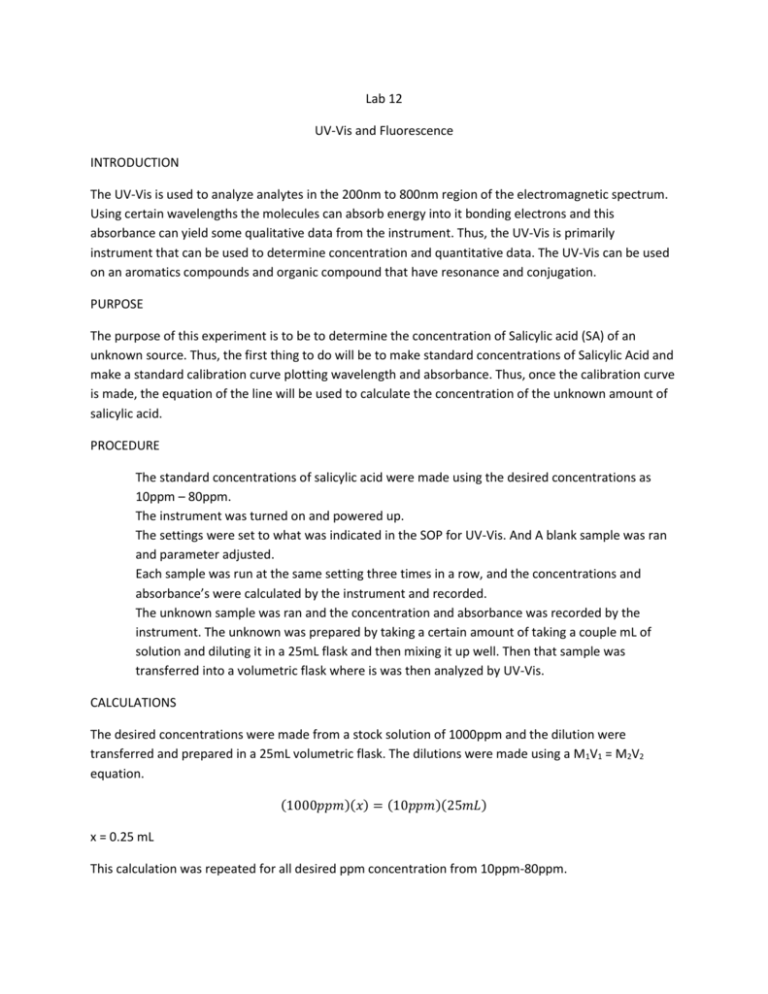
Lab 12 UV-Vis and Fluorescence INTRODUCTION The UV-Vis is used to analyze analytes in the 200nm to 800nm region of the electromagnetic spectrum. Using certain wavelengths the molecules can absorb energy into it bonding electrons and this absorbance can yield some qualitative data from the instrument. Thus, the UV-Vis is primarily instrument that can be used to determine concentration and quantitative data. The UV-Vis can be used on an aromatics compounds and organic compound that have resonance and conjugation. PURPOSE The purpose of this experiment is to be to determine the concentration of Salicylic acid (SA) of an unknown source. Thus, the first thing to do will be to make standard concentrations of Salicylic Acid and make a standard calibration curve plotting wavelength and absorbance. Thus, once the calibration curve is made, the equation of the line will be used to calculate the concentration of the unknown amount of salicylic acid. PROCEDURE The standard concentrations of salicylic acid were made using the desired concentrations as 10ppm – 80ppm. The instrument was turned on and powered up. The settings were set to what was indicated in the SOP for UV-Vis. And A blank sample was ran and parameter adjusted. Each sample was run at the same setting three times in a row, and the concentrations and absorbance’s were calculated by the instrument and recorded. The unknown sample was ran and the concentration and absorbance was recorded by the instrument. The unknown was prepared by taking a certain amount of taking a couple mL of solution and diluting it in a 25mL flask and then mixing it up well. Then that sample was transferred into a volumetric flask where is was then analyzed by UV-Vis. CALCULATIONS The desired concentrations were made from a stock solution of 1000ppm and the dilution were transferred and prepared in a 25mL volumetric flask. The dilutions were made using a M1V1 = M2V2 equation. (1000𝑝𝑝𝑚)(𝑥) = (10𝑝𝑝𝑚)(25𝑚𝐿) x = 0.25 mL This calculation was repeated for all desired ppm concentration from 10ppm-80ppm. The calculation of the unknown data were done using the slope of the line equation of y = 0.0181x + 0.2323. Absorbance of Unknowns Samples at 236nm Trial 1 0.555 Trial 2 0.546 Trial 3 0.530 Average: 0.543 The average absorbance of the unknown data was 0.543. If you insert that number into the equation of the line that was generated by linear regression analysis, as the y-value you will in return obtain a fitted value for the concentration of the sample. 0.543 = 0.0181 (𝑥) + 0.2323 x = 17.1657ppm Concentration Vs. Absorbance For Salicylic Acid At 240nm 1.8 1.6 Absorbance 1.4 1.2 1 0.8 y = 0.0181x + 0.2323 R² = 0.978 0.6 0.4 0.2 0 0 10 20 30 40 50 60 70 80 90 Concentration The standard curve showed that there was a high percent correlation given that the r-squared value was 0.978, thus, showing that there was a 97.8% correlation based on the linear regression analysis. Thus, the equation that we obtained from the data showed to have it is very accurate and precise. Absorbance Values for Standard Concentrations (ppm) Of Salicylic Acid at 240nm Absorbance Concentration 10 0.379 10 0.37 10 0.372 20 0.587 20 0.587 20 0.583 30 0.77 30 0.771 30 0.758 40 1.025 40 1.02 40 1.004 50 1.107 50 1.113 50 1.102 60 1.427 60 1.441 60 1.416 80 1.602 80 1.598 80 1.588 CONCLUSION In conclusion we were able to find the unknown concentration to be the 17.165ppm. The standard curve that we generated used all three results that were used for the when the sample was scanned three times. I think that this was the best way to go when making the standard curve. The equation we generated was adequate because the linear regression that was done to make the best fit line showed that there was a 97.8% correlation and the relatively strong relationship. We ended up not running the 70ppm standard concentration because we were running out of time and we already had enough data points to analyze the unknown thus we decided to use the 80ppm as the end to give a further detection limit for quantifying the unknown concentration. I think that the overall experiment went well because we were able to create a sufficient calibration curve and determine the unknown concentration based on the curve, which showed to have a strong linear relationship between the plotted concentration and absorbance at 240nm. (Next Page fluorescence Lab) Lab 12 Part 2 Fluorescence INTRODUCTION Fluorescence is used in the detection of analyze molecules found in very low concentrations. Not every molecule is capable of fluorescence. In order for a molecules to fluoresce, the molecules has to be able to absorb energy from an excitation source and become stabilized at the ground state of the of the excitation level before relaxes back down to the ground states. Therefore, molecules that are able to fluoresce are naturally selective. In this experiment we will be looking at fluorescence of molecules and determining the concentration of an unknown source. PURPOSE The purpose of this experiment is to understand how the Fluorescent instrument works. Understand how to run samples and analyze data obtained from the instrument. Also, the purpose of this experiment is to understand analytical ways in which you can manipulate the instrument to find unknown concentration and other sources of data or information about the molecules or samples understudy. In this experiment we were given a 100ppm stock solution and then made low concentrations (ppm) standard of 10ppm, 5ppm, 1ppm, and 0.1ppm. Thus, running the standards on the instrument to give an absorbance reading at a certain wavelength which was could then translate into a calibration to find the concentration of quinine in an unknown sample. PROCEDURE Sample Preparation The standard concentrations were made for the stock solution of 100ppm. The standard concentrations were 10ppm, 5ppm, 1ppm, and 0.1ppm. The desired amount of solution was taken from the stock solution and diluted with sulfuric acid. The unknown sample was made in somewhat the same way, however, the sample was not diluted with sulfuric acid but rather it was put into a curvette in its original form. Instrument Set-up The instrument was turned on and set-up. The parameters and setting used were those outlined in the SOP made for this instrument. The standard samples were ran and unknown was ran and absorbance and wavelengths were recorded for each sample. RESULTS Standard Concentration Vs. Absorbance Of Quinine at Approx. 250nm 3.5 3 y = 0.058x + 2.5172 R² = 0.7581 Absorbanc 2.5 2 Series1 1.5 Linear (Series1) 1 0.5 0 0 2 4 6 8 10 12 Concentration (ppm) Standard Concentrations of Quinine at 250nm Concentrations (ppm) Absorbance 0.1 2.477 1 2.491 1 2.4889 5 3.006 5 3.006 10 3.006 10 3.006 The results showed that the equation of the line to be y = 0.058x = 2.5172. The regression analysis showed that it wasn’t that strong. However, it was good enough to be used for determination of quinine in an unknown sample. Absorbance of Quinine if Unknown sample at 508nm Trial 1 3.006 Trial 2 3.006 Trial 3 3.006 The results showed that the absorbance ff quinine in the unknown sample was 3.006, which was similar to was obtained din the higher concentrations. CALCULATIONS The desired concentrations were calculated similar to how the standard concentrations were determined in the UV-Vis experiment. The concentrations were prepared and made by using the M1V1=M2V2 equation. (100𝑝𝑝𝑚)(𝑥) = (10𝑝𝑝𝑚)(25𝑚𝐿) x = 2.5mL The desired standard concentrations were all made using this simple calculation. The unknown concentration was found using the equation of the line generated by the calibration curve. (3.006) = 0.058 𝑥 + 2.5172 x = 8.4258ppm The unknown concentration was found to be 8.4258ppm for the unknown sample of quinine. CONCLUSION In conclusion we found the unknown concentration of quinine to be 8.4258ppm. Thus, I think that this experiment was not as accurate as the previous experiment because the experiment showed to have consistent absorbance values from all standards after 5ppm. Thus, even the unknown sample had an absorbance that was the same. Thus, I think that the actual concentration of the unknown is somewhere above 5ppm. It is relatively still unknown because I think that the instrument is only capable of determining concentrations and absorbance of 5ppm or lower because this is the point where the absorbance values started to be the same. Therefore, I think that the concentration is probably around 8ppm. However, I cannot make a definite conclusion. Another approach to the method would to dilute the unknown sample of quinine, thus, to make the sample able to be adequately detectable using the instrument.
