Online Supplementary Table 1. Least square mean percent change
advertisement
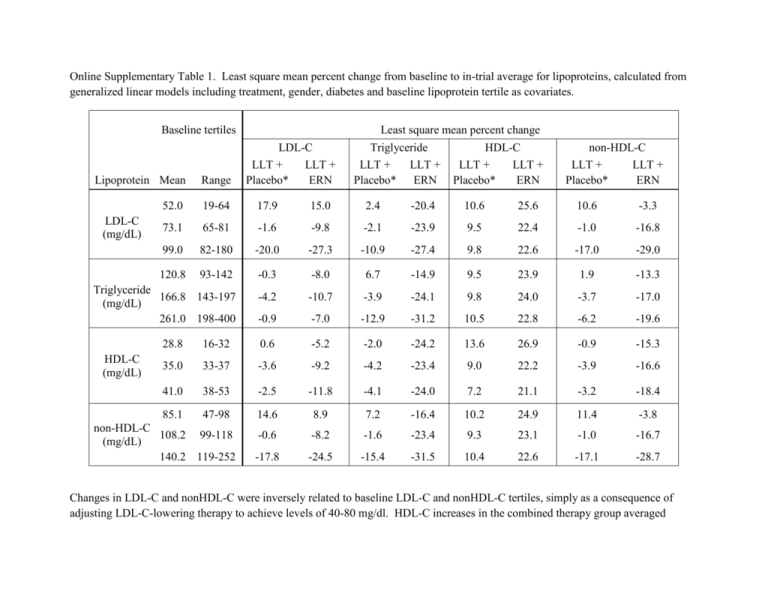
Online Supplementary Table 1. Least square mean percent change from baseline to in-trial average for lipoproteins, calculated from generalized linear models including treatment, gender, diabetes and baseline lipoprotein tertile as covariates. Baseline tertiles Least square mean percent change LDL-C LLT + LLT + Placebo* ERN Triglyceride LLT + LLT + Placebo* ERN HDL-C LLT + LLT + Placebo* ERN non-HDL-C LLT + LLT + Placebo* ERN Lipoprotein Mean Range 52.0 19-64 17.9 15.0 2.4 -20.4 10.6 25.6 10.6 -3.3 73.1 65-81 -1.6 -9.8 -2.1 -23.9 9.5 22.4 -1.0 -16.8 99.0 82-180 -20.0 -27.3 -10.9 -27.4 9.8 22.6 -17.0 -29.0 120.8 93-142 -0.3 -8.0 6.7 -14.9 9.5 23.9 1.9 -13.3 -4.2 -10.7 -3.9 -24.1 9.8 24.0 -3.7 -17.0 -0.9 -7.0 -12.9 -31.2 10.5 22.8 -6.2 -19.6 LDL-C (mg/dL) Triglyceride 166.8 143-197 (mg/dL) 261.0 198-400 HDL-C (mg/dL) 28.8 16-32 0.6 -5.2 -2.0 -24.2 13.6 26.9 -0.9 -15.3 35.0 33-37 -3.6 -9.2 -4.2 -23.4 9.0 22.2 -3.9 -16.6 41.0 38-53 -2.5 -11.8 -4.1 -24.0 7.2 21.1 -3.2 -18.4 85.1 47-98 14.6 8.9 7.2 -16.4 10.2 24.9 11.4 -3.8 -0.6 -8.2 -1.6 -23.4 9.3 23.1 -1.0 -16.7 -17.8 -24.5 -15.4 -31.5 10.4 22.6 -17.1 -28.7 non-HDL-C 108.2 99-118 (mg/dL) 140.2 119-252 Changes in LDL-C and nonHDL-C were inversely related to baseline LDL-C and nonHDL-C tertiles, simply as a consequence of adjusting LDL-C-lowering therapy to achieve levels of 40-80 mg/dl. HDL-C increases in the combined therapy group averaged 25.0% versus 9.8% in the control group, with little variation according to tertiles of any lipoprotein parameter. LLT = LDL-lowering therapy with simvastatin + ezetimibe. ERN = extended-release niacin. *Placebo tablets included 100-150 mg immediate-release niacin. Online Supplementary Table 2. Relationship of cardiovascular events to baseline and in-trial lipoprotein variables, adjusted for potential confounding baseline variables. LLT + Placebo* LLT + ERN SD Hazar d Ratio Hazar d Ratio (95% CI) P LDL-C (mg/dl) 23 0.52 1.03 0.92, 1.15 0.67 0.60 Log TG (mg/dl) 0.93, 1.19 0.43 0.99 0.88, 1.11 0.84 0.48 0.91 0.80, 1.04 0.16 0.96 0.84, 1.08 0.48 0.70 27 1.07 0.95, 1.20 0.26 1.01 0.90, 1.14 0.82 0.34 TC/HDL-C ratio 0.97 1.12 1.00, 1.26 0.06 1.03 0.92, 1.15 0.64 0.22 TG/HDL-C ratio 0.41 1.08 0.95, 1.22 0.24 1.00 0.90, 1.13 0.94 0.44 LDL-C (mg/dl) 23 1.38 1.15, 1.65 0.001 0.99 0.81, 1.21 0.91 0.01 Log TG (mg/dl) 0.34 1.06 0.95, 1.20 0.29 0.99 0.89, 1.10 0.88 0.39 HDL-C (mg/dl) 5.6 0.95 0.84, 1.07 0.38 0.98 0.90, 1.07 0.64 0.85 NonHDL-C (mg/dl) 27 1.32 1.14, 1.54 <0.001 0.98 0.83, 1.16 0.82 0.008 TC/HDL-C ratio 0.97 1.24 1.09, 1.41 0.001 1.04 0.90, 1.21 0.56 0.12 TG/HDL-C ratio 0.41 1.08 0.96, 1.21 0.21 1.01 0.91, 1.11 0.92 0.47 Variable 95% CI P 1.04 0.93, 1.16 0.34 1.05 HDL-C (mg/dl) 5.6 NonHDL-C (mg/dl) Interaction P-value† Baseline In-trial‡ . Notes for Online Supplementary Table 2. This sensitivity analysis is fully consistent with the results presented in Table 1 in the published paper. Each lipoprotein is analyzed separately. Gender, diabetes, age, race, prior CABG, prior PCI, history of hypertension, cerebrovascular disease and arterial vascular disease are included as covariates. Hazard ratios are calculated using Cox Proportional Hazards models. LLT = LDL-lowering therapy, ERN = Extended release niacin, TG = triglyceride, TC = total cholesterol, SD = baseline standard deviation, 95% CI = 95% confidence interval. * Placebo tablets included 100-150 mg immediate-release niacin. † The p-value for the treatment-by-lipoprotein term evaluates the heterogeneity of the effect of lipoprotein across treatment groups. ‡ In-trial lipoprotein values are the average over scheduled visits after randomization and prior to the first confirmed primary event. Online Supplementary Table 3. Relationship of cardiovascular events to in-trial time-dependent* lipoprotein variables. . LLT + Placebo† Variable SD Hazar d Ratio LDL-C (mg/dl) 23 1.22 Log TG (mg/dl) 0.34 1.03 HDL-C (mg/dl) 5.6 0.99 NonHDL-C (mg/dl) 27 1.19 TC/HDL-C ratio 0.97 1.08 TG/HDL-C ratio 0.41 1.04 95% CI 1.09, 1.36 0.94, 1.14 0.89, 1.09 1.07, 1.32 1.03, 1.13 0.94, 1.15 LLT + ERN Interaction P-value Hazard Ratio 95% CI <0.001 1.08 0.94, 1.23 0.27 0.12 0.53 0.99 0.90, 1.08 0.78 0.61 0.80 1.03 0.96, 1.11 0.36 0.72 0.001 1.06 0.94, 1.19 0.33 0.13 0.002 1.06 0.94, 1.18 0.36 0.86 0.47 0.98 0.90, 1.07 0.69 0.57 P P In this sensitivity analysis, the interaction P-values for LDL-C and nonHDL-C, represented as time-dependent variables, are no longer significant, as they are in Table 1 in the published paper. Nevertheless, results shown here do not contradict those of Table 1. Representation of lipoproteins as time-dependent variables emphasizes the effects of short-term lipoprotein changes that can result from dietary or medication nonadherence in subjects experiencing events. Therefore, we consider the initial analysis using within-patient average lipoprotein values most informative. * Lipoprotein values from scheduled visits after randomization and before the first cardiovascular event are included. Hazard ratios are calculated using Cox Proportional Hazards models with time-dependent lipoprotein covariates. Gender and diabetes are included as covariates. Each lipoprotein is analyzed separately. The interaction P-value assesses the heterogeneity of the effect of lipoprotein across treatment groups. † Placebo tablets included 100-150 mg immediate-release niacin. LLT = LDL-lowering therapy, ERN = Extended release niacin, TG = triglyceride, TC = total cholesterol, SD = baseline standard deviation, 95% CI = 95% confidence interval.
