Table S1. - Figshare
advertisement
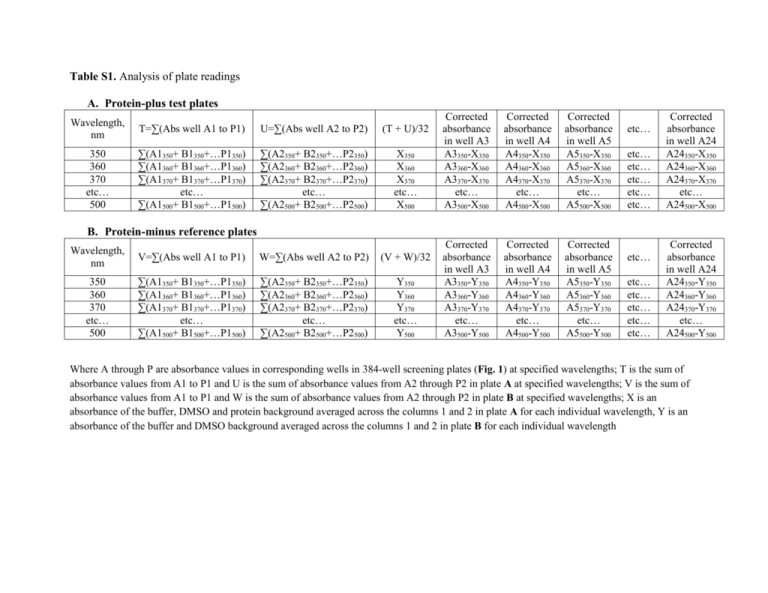
Table S1. Analysis of plate readings A. Protein-plus test plates Wavelength, nm T=∑(Abs well A1 to P1) U=∑(Abs well A2 to P2) (T + U)/32 350 360 370 etc… 500 ∑(A1350+ B1350+…P1350) ∑(A1360+ B1360+…P1360) ∑(A1370+ B1370+…P1370) etc… ∑(A1500+ B1500+…P1500) ∑(A2350+ B2350+…P2350) ∑(A2360+ B2360+…P2360) ∑(A2370+ B2370+…P2370) etc… ∑(A2500+ B2500+…P2500) X350 X360 X370 etc… X500 Corrected absorbance in well A3 A3350-X350 A3360-X360 A3370-X370 etc… A3500-X500 Corrected absorbance in well A4 A4350-X350 A4360-X360 A4370-X370 etc… A4500-X500 Corrected absorbance in well A5 A5350-X350 A5360-X360 A5370-X370 etc… A5500-X500 Corrected absorbance in well A3 A3350-Y350 A3360-Y360 A3370-Y370 etc… A3500-Y500 Corrected absorbance in well A4 A4350-Y350 A4360-Y360 A4370-Y370 etc… A4500-Y500 Corrected absorbance in well A5 A5350-Y350 A5360-Y360 A5370-Y370 etc… A5500-Y500 etc… etc… etc… etc… etc… etc… Corrected absorbance in well A24 A24350-X350 A24360-X360 A24370-X370 etc… A24500-X500 B. Protein-minus reference plates Wavelength, nm V=∑(Abs well A1 to P1) W=∑(Abs well A2 to P2) (V + W)/32 350 360 370 etc… 500 ∑(A1350+ B1350+…P1350) ∑(A1360+ B1360+…P1360) ∑(A1370+ B1370+…P1370) etc… ∑(A1500+ B1500+…P1500) ∑(A2350+ B2350+…P2350) ∑(A2360+ B2360+…P2360) ∑(A2370+ B2370+…P2370) etc… ∑(A2500+ B2500+…P2500) Y350 Y360 Y370 etc… Y500 etc… etc… etc… etc… etc… etc… Corrected absorbance in well A24 A24350-Y350 A24360-Y360 A24370-Y370 etc… A24500-Y500 Where A through P are absorbance values in corresponding wells in 384-well screening plates (Fig. 1) at specified wavelengths; T is the sum of absorbance values from A1 to P1 and U is the sum of absorbance values from A2 through P2 in plate A at specified wavelengths; V is the sum of absorbance values from A1 to P1 and W is the sum of absorbance values from A2 through P2 in plate B at specified wavelengths; X is an absorbance of the buffer, DMSO and protein background averaged across the columns 1 and 2 in plate A for each individual wavelength, Y is an absorbance of the buffer and DMSO background averaged across the columns 1 and 2 in plate B for each individual wavelength

