Scientific Method, Statistics and Making Informed Decisions
advertisement
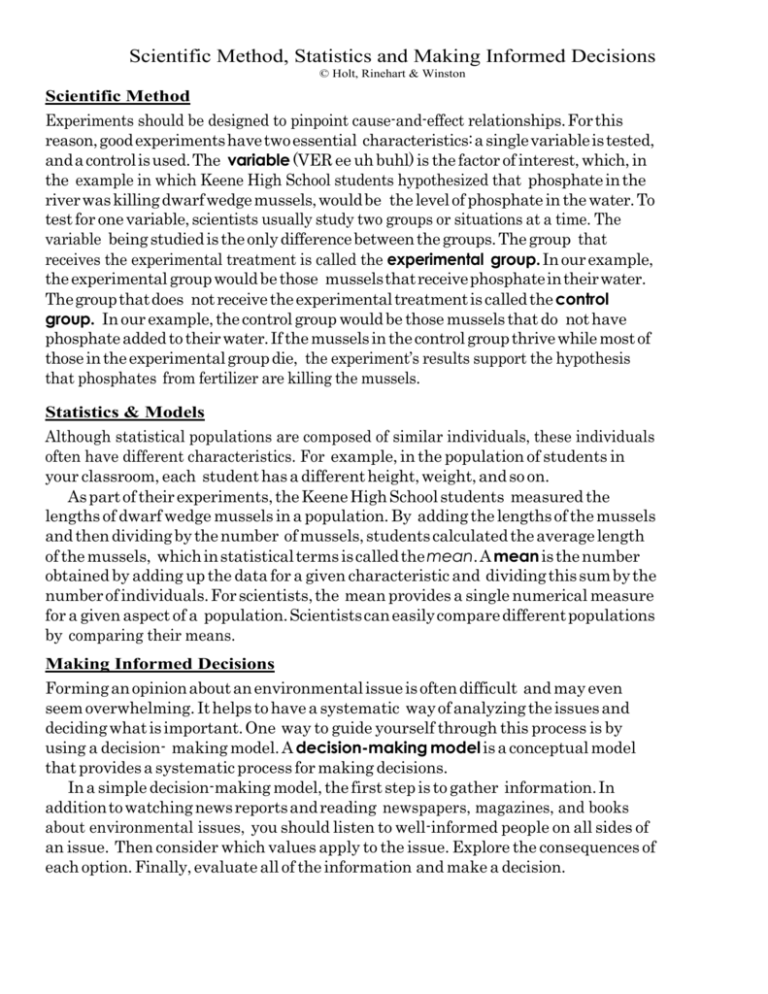
Scientific Method, Statistics and Making Informed Decisions © Holt, Rinehart & Winston Scientific Method Experiments should be designed to pinpoint cause-and-effect relationships. For this reason, good experiments have two essential characteristics: a single variable is tested, and a control is used. The variable (VER ee uh buhl) is the factor of interest, which, in the example in which Keene High School students hypothesized that phosphate in the river was killing dwarf wedge mussels, would be the level of phosphate in the water. To test for one variable, scientists usually study two groups or situations at a time. The variable being studied is the only difference between the groups. The group that receives the experimental treatment is called the experimental group. In our example, the experimental group would be those mussels that receive phosphate in their water. The group that does not receive the experimental treatment is called the control group. In our example, the control group would be those mussels that do not have phosphate added to their water. If the mussels in the control group thrive while most of those in the experimental group die, the experiment’s results support the hypothesis that phosphates from fertilizer are killing the mussels. Statistics & Models Although statistical populations are composed of similar individuals, these individuals often have different characteristics. For example, in the population of students in your classroom, each student has a different height, weight, and so on. As part of their experiments, the Keene High School students measured the lengths of dwarf wedge mussels in a population. By adding the lengths of the mussels and then dividing by the number of mussels, students calculated the average length of the mussels, which in statistical terms is called the mean. A mean is the number obtained by adding up the data for a given characteristic and dividing this sum by the number of individuals. For scientists, the mean provides a single numerical measure for a given aspect of a population. Scientists can easily compare different populations by comparing their means. Making Informed Decisions Forming an opinion about an environmental issue is often difficult and may even seem overwhelming. It helps to have a systematic way of analyzing the issues and deciding what is important. One way to guide yourself through this process is by using a decision- making model. A decision-making model is a conceptual model that provides a systematic process for making decisions. In a simple decision-making model, the first step is to gather information. In addition to watching news reports and reading newspapers, magazines, and books about environmental issues, you should listen to well-informed people on all sides of an issue. Then consider which values apply to the issue. Explore the consequences of each option. Finally, evaluate all of the information and make a decision. After reading the passages above answer the following: 1. What are two essential characteristics of a good experiment? 2. How do scientists usually test for one variable? 3. How should experiments be designed? 4. Can one individual represent an entire population? Why or why not? 5. How can scientists compare two different populations? 6. How is a mean established? 7. The suffix -ate means “to act on.” If the word values means “principles or standards we consider important,” what is the meaning of the word evaluate? 8. What is a decision-making model? 9. What is the effect of using both a variable and a control in an experiment? 10. In the example used in this passage, what would the students know if the mussels in the experimental group died? 11. What do a control group and an experimental group have in common? 12. In the experiment discussed in the passage, what is the variable? 13. The group that does not receive an experimental treatment is called the ____________________ 14. The group that receives the experimental treatment is called the ___________________________ In the space provided, write the letter of the term or phrase that best answers each question. 15. The mean provides a single numerical measure for one a. individual c. dwarf wedge mussel b. average d. characteristic of a population. 16. For which characteristic did Keene High School students establish a mean? a. height c. length b. weight d. taste 17. What did Keene High School students do with this characteristic to determine the mean? a. added the data for the characteristic and divided the sum by the number of mussels b. added the data for the characteristic and multiplied by the number of mussels c. added the data for the characteristic and subtracted it from the number of mussels d. added the data for the characteristic with the number of mussels 18. Which of the following can help you when you want to form an opinion or make a decision? a. having many friends so they can tell you what they think b. listening to the opinions of all the adults around you c. finding one source of information that can tell you all you need to know d. having a systematic way of analyzing issues 19. Which of the following sources should you use when gathering information to help you make a decision about environmental issues? a. the TV news c. books and magazines b. local newspapers d. all of the above 20. What is a good system of analyzing issues? a. using a cause-and-effect chart b. determining the mean for a population c. using a decision-making model d. performing experiments 21. Whose opinions should you seek when you are trying to make a decision? a. your relatives’ and teachers’ b. your friends’ c. well-informed people’s on all sides of the issue d. well-informed people’s on the side of the issue that best matches your values 22. The differences observed between control groups and experimental groups can help identify relationships. c. cause-and-effect c. conditional d. inverse-and-converse d. unconventional Sequence the statements below to show the steps in the process used in determining the average. Write “1” on the line in front of the first step, “2” on the line in front of the second step, and so on. ______ Divide the sums of the data by the number of individuals in each population. Compare the means of the two populations. Measure and record the characteristic data of all individuals. Identify a characteristic common to different populations. Add up the characteristic data from each population. Evaluate all the information. Explore the consequences of each option. Consider which values apply to the issue. Make a decision. Gather information from many sources.
