What is still lacking in refractive surgery is the role of neuroprocessing
WHAT IS STILL LACKING IN REFRACTIVE SURGERY IS THE ROLE OF
NEUROPROCESSING
(D.T.H. Tan 123 )
Singapore Eye Research Institute (SERI) 1 , Singapore National Eye Center (SNEC) 2 ,
Dept of Ophthalmology, National University of Singapore 3
Introduction: Does a perfect cornea guarantee perfect vision? Can we sea clearly despite the existence of a refractive error? Can we enhance vision beyond 20/20 to super vision?
The eye care industry has focused a majority of its resources on solving problems associated with the ocular or “front end” of the visual system. However not many have addressed the neural processing, which plays an important role in determining the quality of vision.
NeuroVision’s NVC vision correction technology is a non-invasive, patient-specific treatment based on visual stimulation and facilitation of neural connections responsible for vision. It involves the use of an internet-based computer generated visual training exercise regime using sets of patient specific stimuli based on Gabor patches, to sharpen contrast sensitivity and visual acuity.
Scientific Background: Visual processing in the primary visual cortex involves the integrated activity of many neurons, with interneural interactions effecting both excitation and inhibition. Visual contrast activates neurons involved in vision processing, and neural interactions determine the sensitivity for contrast at each spatial frequency, and the combination of neural activities set Contrast Sensitivity Function (CSF). The relationship between neuronal responses and perception are mainly determined by the signal-to-noise ratio (S/N ratio) of neuronal activity, and the brain pools responses across many neurons to average out noisy activity of single cells, thus improving S/N ratio, leading to improved visual performance and acuity.
Studies have shown that the noise of individual neurons can be controlled by appropriate choice of stimulus conditions, and contrast sensitivity at low levels can be increased dramatically through control of stimulus parameters. This precise control of stimulus conditions leading to increased neuronal efficiency is fundamental in initiating the neural modifications that are the basis for brain plasticity. Brain plasticity (the ability to adapt to changed conditions in acquiring new skills) has been demonstrated in many basic tasks, with evidence pointing to physical modifications in the adult cortex during repetitive performance.
NeuroVision’s technology probes specific neuronal interactions, using a set of patient-specific stimuli that improve neuronal efficiency and induce improvement of CSF due to a reduction of noise and increase in signal strength. As visual perception quality depends both on the input received through the eye and the processing in the visual cortex, Neur oVision’s technology compensates for blurred (myopic) inputs, coming from the retina, by enhancing neural processing.
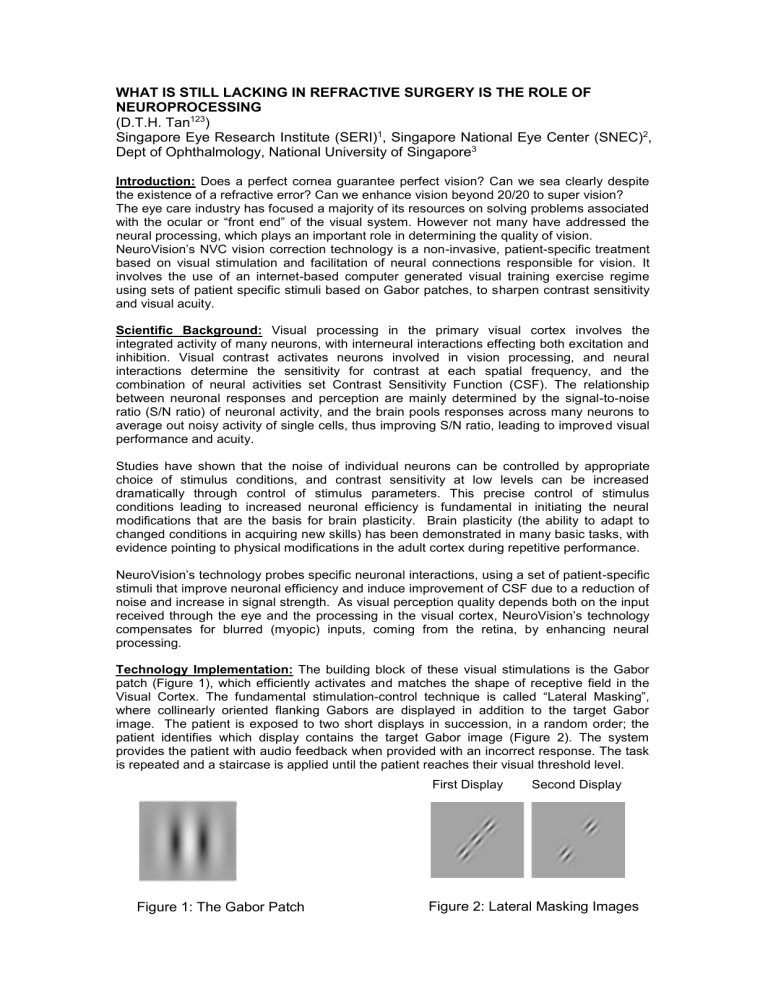
Technology Implementation: The building block of these visual stimulations is the Gabor patch (Figure 1), which efficiently activates and matches the shape of receptive field in the
Visual Cortex. The fundamental stimulationcontrol technique is called “Lateral Masking”, where collinearly oriented flanking Gabors are displayed in addition to the target Gabor image. The patient is exposed to two short displays in succession, in a random order; the patient identifies which display contains the target Gabor image (Figure 2). The system provides the patient with audio feedback when provided with an incorrect response. The task is repeated and a staircase is applied until the patient reaches their visual threshold level.
First Display Second Display
Figure 1: The Gabor Patch Figure 2: Lateral Masking Images
Purpose: We evaluated the efficacy of NVC treatment in the enhancement of unaided contrast sensitivity function (UCSF) and unaided visual acuity (UAVA) in subjects having low degrees of myopia and subjects who are post refractive surgery with residual myopia and reduced UCSF.
Methods: The results reported here include data collected in a clinical trial conducted in
Singapore, commercial data from Singapore, and international supporting data from Malaysia,
Korea and Brazil.
The results include 2 groups of patients: a. Low Myopia (LM) b. Post Refractive Surgery patients (PRS)
Patients underwent 30-minute treatment sessions on an alternate day basis until no further improvement occurred (mean number of treatment sessions is 35). Investigations included manifest and cycloplegic refraction, LogMAR UAVA and UCSF using Sine Wave Contrast
Sensitivity charts.
Results:
Subjects comprised 150 male and 108 female with a mean age of 30 years (range 7 to 55).
LM group includes 230 subjects and PRS group - 28. For the sake of baseline data comparison, we created LM and PRS subgroups extracting out those having UAVA better than 0.1 logMar and worse than 0.6 logMar, and further extracted out from the LM group those with the worst Spherical Equivalent until achieving similarity in refraction and UAVA.
Table 1: Baseline data (entire groups, and subgroups with equal mean refraction)
Both the LM and PRS groups have in average reduced baseline UCSF, which is below normal range at mid and high spatial frequencies. It appears that the PRS group has worse
UCSF in comparison with the LM group, with respect to their average refraction.
LM, SPH -1.3D LM, SPH -0.9D
PRS, SPH -0.94D PRS, SPH -0.90D
Figue 4: Baseline UCSF – entire group Figue 5:Baseline UCSF - subgroups
189 Patients have completed NeuroVision treatment, including 165 LM patients and
24 PRS patients. The following tables detail the treatment results:
Table 2: Visual improvement following NVC treatment – LM
LM
All
All
Study
Brazil
Singapore
Commercial
Singapore
Commercial
Malaysia
Commercial
Commercial
No. of
Eyes
Baseline 330
End
Baseline 40
End
Baseline 290
End
Baseline 256
End 256
Baseline 24
End 24
Baseline 10
End
330
40
290
10
Average UCSF
Refraction
(Diopters)
Average UCVA
(LogMAR)
1.5
(cpd)
3
(cpd)
6
(cpd)
12
(cpd)
18
(cpd)
-1.34 ± 0.03
0.44 ± 0.01
38.3
36.5
20.2
5.7
2.0
1.20 ± 0.04
0.17 ± 0.01
100.96
114.8
101.2
38.19
11.38
1.14 ± 0.07
0.31 ± 0.03
42.0
55.4
39.4
12.8
3.5
1.07 ± 0.07
0.10 ± 0.03
68.4
95.9
84.1
35.9
10.3
1.37 ± 0.03
0.45 ± 0.01
37.9
34.5
18.4
5.1
1.9
1.22 ± 0.04
0.18 ± 0.01
106.5
117.7
103.8
38.5
11.5
1.38 ± 0.03
0.46 ± 0.01
37.6
33.2
17.6
4.6
1.7
1.24 ± 0.04
0.19 ± 0.01
107.5
116.1
99.0
36.2
10.1
1.30 ± 0.13
0.43 ± 0.05
37.7
42.5
18.1
7.9
3.4
N/A 0.11 ± 0.03
103.8
144.8
162.2
78.8
40.3
1.06 ± 0.06
0.42 ± 0.05
46.3
56.8
60.6
22.1
11.8
N/A 0.11 ± 0.03
90.0
103.1
119.1
33.4
15.6
Table 3: Visual improvement following NVC treatment – PRS
PRS
All
Singapore
Study
Singapore
All Commercial
Commercial
Baseline
End
No. of
Eyes
48
48
Baseline 14
End 14
Baseline 34
End 34
Baseline 18
End 18
Average
UCSF
Refraction
(Diopters)
Average UCVA
(LogMAR)
1.5
(cpd)
3
(cpd)
6
(cpd)
12
(cpd)
18
(cpd)
1.14 ± 0.11
0.34 ± 0.03
25.5 46.4 25.2 10.4 2.6
1.09 ± 0.12
0.12 ± 0.02
64.2 83.0 78.0 41.3 12.3
-1.55 ± 0.30
0.26 ± 0.04
27.5
68.6
36.0
22.9 2.9
-1.49 ± 0.26
0.12 ± 0.04
38.8
75.9
60.3
23.6
6.7
1.02 ± 0.11
0.38 ± 0.04
24.7
37.2
20.7
5.2
2.5
0.96 ± 0.14
0.12 ± 0.03
74.7
85.9
85.3
48.6
14.7
1.19 ± 0.13
0.41 ± 0.04
31.7
34.3
17.9
4.4
2.0
1.04 ± 0.13
0.10 ± 0.03
102.9
108.0
111.6
60.5
18.5
Korea (10),
Japan (4),
China (2)
Commercial
Baseline 16
End 16
0.79 ± 0.19
0.35 ± 0.07
18.6
40.8
24.5
6.3
3.2
0.87 ± 0.26
0.15 ± 0.05
49.4
63.9
60.4
36.6
10.9
Mean baseline UCSF has improved at all spatial frequencies to within the normal range.
End, UCVA=0.15
Baseline, UCVA=0.43
End, UCVA=0.12
Baseline, UCVA=0.34
Figue 4: LM UCSF improvement Figue 5: PRS UCSF improvement
Mean manifest refractive error was not significantly changed after treatment: from a -
1.34D
0.03 to -1.20D
0.04 in the LM group, and from -1.14D
0.11 to -1.09D
0.12 in the PRS group
Eyes with a higher refraction showed greater visual improvement:
Mean LM UAVA improvement (LogMAR) was
0.30 for eyes with refraction between -1.5D (n=144) and above
0.25 for eyes with refraction between –1.0D and –1.5D (n=135),
0.21 for eyes with refraction below –1.0D (n=51)
Study patients have been monitored for 12 months after treatment end.
Vision improvement appears to be retained for at least 12 months.
No side-effects were encountered during treatment.
0.3
0.2
0.1
0
Base EOT 3M 6M
Conclusions
LM patients and PRS patients suffer from reduced UCSF and UCVA.
PRS patients tend to suffer from worse UCSF comparing to LM patients having similar refraction.
9M 12M
Results of the NVC treatment suggest that this technology is able to improve
UCSF and UCVA in adults with LM or PRS to within normal range. This improvement appears to be retained for at least 12 months after treatment. A large-scale, placebo-controlled randomized clinical trial is currently undergoing.
References
1. Polat, U., Ma-Naim, T. Belkin, M. Sagi, D. Improving vision in adult amblyopia by perceptual learning. PNAS 101, 6692-97 (2004).
2. Dosher, B. A. & Lu, Z. L. Mechanisms of perceptual learning. Vision Res
39 , 3197-221. (1999).
3. Polat, U., Mizobe, K., Pettet, M. W., Kasamatsu, T. & Norcia, A. M.
Collinear stimuli regulate visual responses depending on cell's contrast threshold. Nature 391 , 580-4 (1998).
4. Polat, U. & Sagi, D. Lateral interactions between spatial channels: suppression and facilitation revealed by lateral masking experiments.
Vision Res 33 , 993-9 (1993).
5. Hubel, D. H. & Wiesel, T. N. Receptive fields, binocular interaction and functional architecture in the cat's visual cortex. J. Physiol. (Lond.) 160 ,
106-154 (1962).
