Powerpoint - Jacob Pifer
advertisement
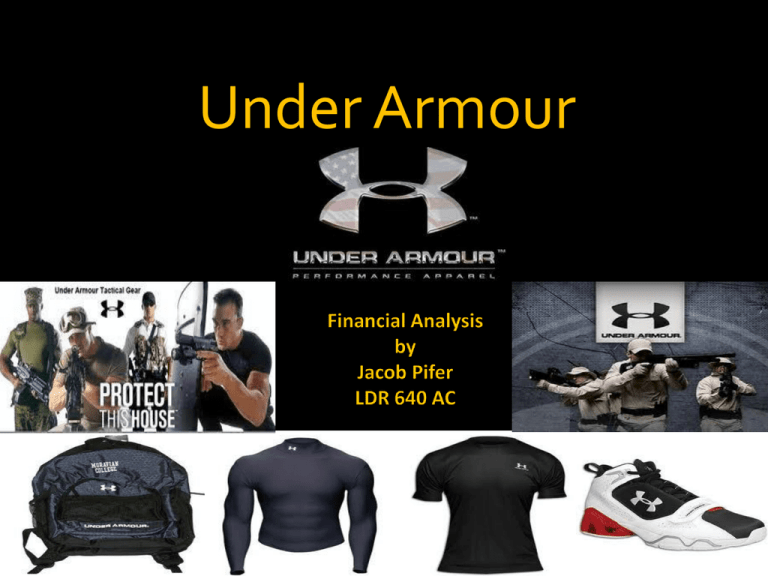
Under Armour Founded in 1996 in the Basement of a Georgetown Home Now based in Baltimore, Maryland Offices throughout the world Toronto, Japan, China and Amsterdam Employs over 2,000 workers worldwide Owns over 70% of Performance Apparel Market Governing Board Kevin Plank – CEO, President, Chairman Brad Dickerson – Chief Financial Officer Wayne Marino – Chief of Operations J. Scott Plank – Executive Vice President Business Development Kip J. Fulks Executive Vice President - Product Mark M. Dowley Executive Vice President Global Brand President - International Horizontal Analysis (in thousands) 2009 2008 2007 2009 2008 2007 Revenues $856,411 $725,244 $606,561 118% 119% 100% Cost of goods sold $443,386 $370,296 $301,217 119% 123% 100% Gross Profit $413,025 $354,948 $305,044 116% 116% 100% Selling Expense $327,752 $278,023 218,779 118% 127% 100% Income Operations $85,273 $76,925 $86,265 111% 89% 100% Interest inc (exp) ($2,344) $(850) $749 -275% -113% 100% Other Inc (Exp) ($511) ($6,175) $2029 1235% -304% 100% Income before tax $82,418 $69,900 $89,043 118% 78% 100% Taxes $35,633 $31,671 $36,485 Net Income $46,785 $38,229 $52,558 122% 72% 100% Balance Sheet (in thousands) Assets 2009 2008 2007 Cash and cash equivalents $187,297 $102,042 $40,588 Accounts Receivables $79,356 $81,302 $93,515 Inventories $148,488 $182,232 $166,082 Prepaid expenses and other Current Assets $19,989 $18,023 $11,642 Deferred income taxes $12,870 $12,824 $10,418 $448,000 $396,423 $322,245 Property and Equipment $72,926 $73,548 $52,332 Other long term assets $10,754 $8,897 $7,863 Deferred income taxes $13,908 $8,687 $8,173 Total Assets $545,588 $487,555 $390,613 Current Assets Total Current Assets Balance Sheet (in thousands) Current Liabilities 2009 2008 2007 Revolving Credit ---- $25,000 --- Accounts Payable $68,710 $72,435 $55,012 Accrued Expenses $40,885 $25,905 $36,111 Current Maturities $9275 $7431 $4,576 Other Current Liabilities $1292 $2337 --- $120,162 $133,110 $95,699 Long Term Debt $10,948 $13,061 $9,298 Capital Lease Obligations ---- $97 $458 Other Long Term Liabilities $14,481 $10,190 $4,673 Total Liabilities $145,591 $156,458 $110,128 Total Stockholder’s Equity $399,997 $331,097 $280,485 Total Liabilities and Equity $545,588 $487,555 $390,613 Total Current Liabilities Current Ratio: Liquidity Ratios Industry Avg 3.7x 3.5x Quick Ratio: 2.2x 1.1x Asset Management Ratios Industry Avg Days Sales Outstanding: 34.2 43 Total Asset Turnover 1.66x 1.7x DEBT MANAGEMENT RATIOS Debt Ratio: 27% PROFITABILITY RATIOS Profit Margin: 5.4% ROA: 9% ROE: 12.8% Industry Average TIE Ratio: 36.1 Industry Average: 2.2 Book Value Per Share $7.96 Conclusion Under Armour is gaining ground on the giant that is NIKE. Under Armour appears to be on solid financial ground. Under Armour is reaching out to other markets, ie Military and Law Enforcement Once Under Armour fully launches the footwear and apparel lines in these other markets, they will become a very successful company. References: •Business Week. http://investing.businessweek.com/research/stocks/financials/rati os.asp?ticker=UA:US •Sports Illustrated online. http://sportsillustrated.cnn.com/2009/more/04/09/under.armour /index.html •Under Armour INC online. http://investor.underarmour.com/company/about.cfm Thank You
