BPP talk 3 Dec 2012
advertisement
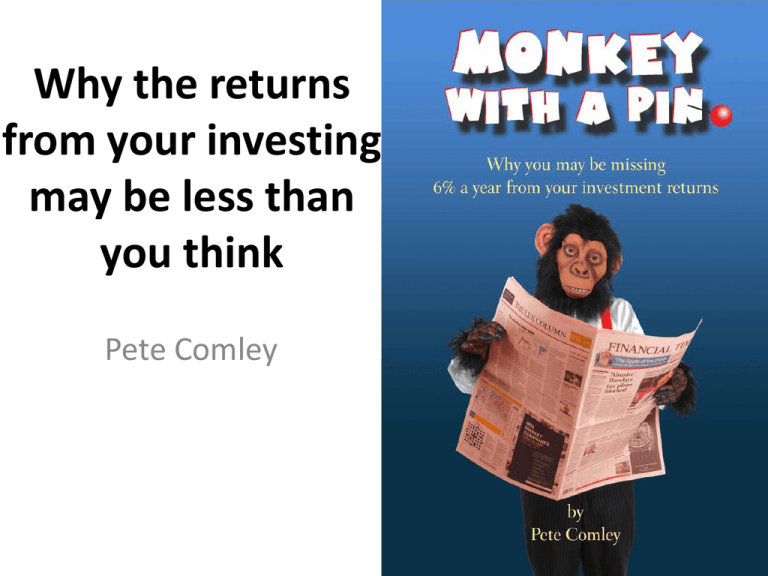
Why the returns from your investing may be less than you think Pete Comley Disclaimer This talk is for educational purposes only and does not constitute professional advice. Q. How much do you hope to make on your investments in 2013? 0-5% 6-10% 11-20% 20%+ “[Our aim is] to help you return 12–15% per year over the long term.” “Historically, [stocks] yield an investment return of about 10%.” Annual Real Returns on Equities and Cash (after inflation) 1899-2011 4.9% 0.9% Equities Source: Barclays Equity Gilt Study, 2012 Cash Returns are less over the last decade 4.9% 1.2% 0.9% 0.2% 2001-2011 1899-2011 Equities Source: Barclays Equity Gilt Study, 2012 Cash Is the return calculation really that simple? These are theoretical returns. What about…. Skill Returns Costs • Stocks/funds you pick • Your strategies • Timing of your trades • Published indices • Dividends • Survivorship bias • • • • • • • • • • Annual fund charges Commissions to intermediaries Bid/offer spread Trading commissions ‘Price impact’ Broker account fees IFA fees Stamp Duty Tax on dividends Capital gains tax How do best measure skill? Results of Shares4Schools Competition 2011 8.1% Average gain/loss of a school FTSE All Share Index gain/loss -13.1% Just 6 of the 72 schools beat the FTSE % Net Gain/Loss of UK StockChallenge Investors vs FTSE 2011 -30.5% 2010 26.5% 2009 2008 2007 51.5% -28.5% -16.3% 2006 -13.5% 2005 -13.9% 2004 Average -6.5% -3.9% Source: http://stockchallenge.co.uk/ Monkeywithapin = the random stock picking entry in the UK Stock Challenge competition 2011 – Monkey in top 10% 2012 – Monkey in top 10% Ola the Chimp Competition over a month with 5 pro traders. Ola’s gains X4 best other pro! Wall Street Journal Competition • 147 monthly competitions between 1990-2002 • The competition: – Top 4 Wall Street pros each picked a stock vs – Editorial staff threw darts into the paper • Results assessed after 6 months Re-analysis of Wall Street Journal Random Darts vs Pro Investors Competition He invested $1 on each of the four dartboard tips each month and just held those shares until the end in August 2002. He invested $1 on each of the four pros tips each month and at the end of each 6 months competition, he sold them all and invested the proceeds and another $4 into the pros next set of 6 month tips. As a control, he invested $4 a month into an index tracking fund of the US market (the Vanguard Index Trust 500). Source: E.Porter , Journal of Applied Finance (2004) $1,368 $1,091 $957 Amounts Lost Per Year by the Average Taiwanese Investor Trading losses -1.3% Commission charges -1.2% Stamp duty tax TOTAL -1.3% -3.8% Source: Barber, Lee, Li and Odean, University California Berkeley, Working Paper (2005) Why skill is low: x Poor stock picking x Bad timing Investors in funds worse • DALBAR analyses ALL US mutual funds • Returns after inflation over last 20 years: -5%pa • -5% a combination of: – Poor fund selection/timing – Fees £35 8000 £30 7000 £25 6000 £20 5000 £15 4000 £10 £5 3000 £0 2000 Source: IMA FTSE (December 1st) Net fund retail sales (£bn) Fund Sales are Correlated to the FTSE Factors reducing investors returns Skill/alpha of the investor Skill/alpha of a fund manager Investors in shares directly Investors in funds directly –1.3% –2.2% n/a +0.2% What is the FTSE? Change in the top 20 FTSE shares from 2001-2011 Vodafone Group BP Amoco GlaxoSmithKline HSBC Holdings AstraZeneca Shell Transport & Trading Royal Bank of Scotland Lloyds TSB Group British Telecommunications Barclays Diageo Cable & Wireless CGNU Prudential British Sky Broadcasting Marconi Tesco Abbey National Unilever plc Reuters Group AVERAGE (top 20) FTSE 100 -29% -10% -33% -30% -12% 11% -97% -90% -33% -87% 60% -87% -62% -37% -34% -100% 57% -54% 244% -35% -23% -3% Source: Comley (2012) Disappearing funds • In the UK, the fund industry closes 10% of failing funds each year • Beware: Fund stats only show successful ones! • Estimated effect = -1% pa Source: Rohleder, Scholz, Wilkens, Review of Finance (2011) Effects of survivorship bias on indices • I can’t find any definitive work on it (idea for a dissertation??) • However not using complete datasets has a massive impact on financial models Source: Frank Hassler – http://engineering-returns.com Factors reducing investors returns Skill/alpha of the investor Skill/alpha of a fund manager Index error due to survivorship bias Investors in shares directly Investors in funds directly –1.3% –2.2% n/a +0.2% –1.0% –1.0% Q. What is the average size of your trades? £250 (or less) £500 £1000 £++more Costs of trading shares Commissions £250 10% £500 5% £1000 2.5% Stamp duty Spread TOTAL 0.5% 0.5% 0.5% 0.7% 0.7% 0.7% 11.2% 6.2% 3.7% + account fees + tax Fund Charges • Annual fees (TER): 1.7% – Can be less on passive funds – Can be a lot more! • Bid/offer spread: 5% – Can often be much less* * For my calculations, I have assumed an average 2.5% spread amortised over 5 years i.e. 0.5% pa. • Distribution levy: small The Hidden Costs • TER (Total Expense Ratio) excludes: – Trading commissions – Stamp duty – Bid/offer spreads – Price impact • Hidden costs are very dependent on Portfolio Turnover Rate (PTR). • Assuming 60% PTR, hidden costs = 0.6% Investors in shares directly Investors in funds directly –1.3% –2.2% n/a +0.2% Index error due to survivorship bias –1.0% –1.0% Trading commissions –2.5% –0.1% Stamp duty –0.5% –0.3% Bid/offer spreads –0.7% –0.1% Price impact n/a –0.1% Initial charge/distribution levy n/a –0.5% TER n/a –1.7% –6.0% –5.8% Factors reducing investors returns Skill/alpha of the investor Skill/alpha of a fund manager TOTAL -0.6% True Returns on Equities vs “Cash” over the last 20 years 4.8% 2.90% -1.2% Theoretical equity return 1991-2011 Actual equity return Cash -Building society returns Example: Endowment Policy • • • • 25 year policy from 1988-2013 Projected returns: >£48k Paid in: £17,250 Value now: £27,500 (4.2% growth) – But inflation averaged 3.5% – Stock market return of 9.2% • Where is the missing 5%??? Cash would have better than share investing over the last 20 years £100,000 £80,000 Real equity returns £60,000 Janet (Cash ISA) John (Share ISA) £40,000 Total contributions £20,000 £0 1991 1993 1995 1997 1999 2001 2003 2005 2007 2009 2011 What might be future equity returns? • Deutsche Bank predicting 0.6% above inflation (in the US) for the next decade • Barclays Mortgage Dept now assume returns from Stock ISA investments over next 25 years will be: – Just the cash you pay in (not even inflation added) What might be future cash returns? • “Financial repression” will ensure: interest rates remain low (for as long as possible) However don’t expect cash to outperform in the future £17,500 £16,829 £15,000 £14,875 £13,552 £12,500 £10,000 Inflation @ 5% John (Monkey Share ISA) £7,500 Janet (Cash ISA) £5,000 £2,500 £0 2012 2014 2016 2018 2020 2022 Three tips to cut your costs 1. Trade less 2.Trade less 3.Trade less Some other tips to cut your costs • • • • Pay no more than £10-£12 commissions Trade as large a size as possible Check bid/offer spread before buying Read small print charges and avoid any that charge annual fees, inactivity fees, etc • Pick funds that have low annual charges and low initial charges/provide rebates • Use funds for international exposure What’s the best strategy? “Buy and hold will be poor option [over the next decade]” Turtle Traders • Richard Dennis bet William Eckhardt that anyone could be trained in 2 weeks to be a successful trader • 2 of the 14 went on to earn $175m • The secret: follow a system The secret to successful investing Recognise that you need rules Determine some good rules Follow those rules My Strategy My view on the FTSE FTSE 50 Cyclically Adjusted PE ratio (S&P index) 45 40 35 30 25 20 15 10 5 0 1881 1891 1901 1911 1921 1931 1941 1951 1961 1971 1981 1991 2001 2011 My stock selection strategy • Low cost trackers • Stocks selected by a monkey Finally, the missing 6% equates to: £170bn a year UK Health and Education budget £3000 for every UK citizen Thank you You can download the book for FREE in all eBook formats from monkeywithapin.com
