Role of Ethanol Plants in Dakotas Land Use Change Regression Framework Introduction
advertisement
Role of Ethanol Plants in Dakotas Land Use Change
Gaurav Arora*, David A. Hennessy**, Hongli Feng***
Introduction
Recent research has identified changing land-use
patterns in the Prairie Pothole Region of the US Great
Plains. The Dakotas, with 271,000 ha net conversions
from grasslands to corn/soybean production from 2006
to 2011 (Wright and Wimberley, 2013), are central to
this phenomenon. The implications range from reduced
biodiversity and loss of habitat for waterfowl species, to
costly crop practices due to low agricultural productivity
on these marginal lands (Johnston, 2014). Although
much has been done in characterizing these transitions,
efforts lack in explaining the market forces underlying
these changes. We utilize quasi-experimental
techniques and high-resolution satellite data to consider
how the presence of an ethanol plant has affected
cropping patterns for the Dakotas.
Regression Framework
Preliminary Estimation Results
Using the matched sample of T and C groups, we estimate:
We use the following controls for regression results in the
following tables.
Yi ,t 0 1 dt 2dt 3di dt 4 (t)Xi i ,t ; where
Xi = {% Grasslands and Pasture; % Wheat;
their interactions with di }
Yi ,t land-use acreage for parcel i at t ,
dt 1 for post-treatment period and 0 otherwise,
di = 1 for i in treatment group and 0 otherwise, and
Xi = vector of other control variables.
Methods
We use the Difference-in-Difference (DID) approach in
conjunction with Propensity Score Matching (PSM).
Possible endogeneity of an ethanol plant’s location in
anticipation of land-use change is a major concern. The
DID approach circumvents this problem by eliminating
trend- and individual- fixed effects and PSM controls for
the presence of unobservables that may otherwise result
in biased estimates (List et al. 2003).
Treatment Effect: In most cases, our treatment
coefficients’ estimates are insignificant. Although,
we find some significant impacts, negative for
corn/soybean and positive for wheat, these
estimates are sensitive to choice of regressor and
hence unreliable. Moreover, their significance does
not hold for their counterparts in other time periods.
Other Control Variables: Our results also reveal that
higher grass or pasture acreage, prior to the
treatment, has significantly positive impact on
production of corn/soy and wheat. However, more
wheat, prior to treatment, has a stronger positive
impact on corn/soybean acreage than grass or
pasture. This reflects a lower cost of conversion from
wheat to corn/soy than from grass/pasture to
corn/soy. Further, we do not find our coefficient
estimates for these controls to vary between
treatment and control groups.
Defining Treatment (T)
and Control (C) Groups
We assume transportation costs, monotonic in
Euclidian distance from the plant, to be paid for by
the corn producer. All else equal, a representative
supplier nearer to the plant has higher incentive to
produce corn than the one farther away.
Consequently, T samples in our case are closer to the
ethanol plant than C samples.
We also utilize a 1:1 Nearest Neighbor PSM Algorithm
in conjunction with DID to compare groups with
similar propensity for being treated conditional on soil
characteristics – Slope and Land Capability Class. We
estimate an Average Treatment Effect (ATT and
denoted by ) for individual ethanol plants.
Caveat and Future Work
Our ad-hoc treatment and control groups are not
exhaustive, since we deal with a non-exogenously
defined change/policy. Replicating our analysis with
falsified treatments (i.e., placebo tests) without an
ethanol plant, spatially and temporally, will serve as
robustness checks.
E[Y (i ,t1 ) Y (i ,t0 )| P(di 1| Z ), X (i )]
T
T
E[Y (i ,t1 ) Y (i ,t0 )| P(di 1| Z ), Xi ];
where t1 / t0 = post/pre-treatment period,
U
U
T /U
Y (i ,.) = land-use acreage for treated/untreated parcel-i ,
P(di 1| Z ) Parcel i's conditional propensity of treatment,
Z (Slope, Land Capability Classes},and
Xi = other controls.
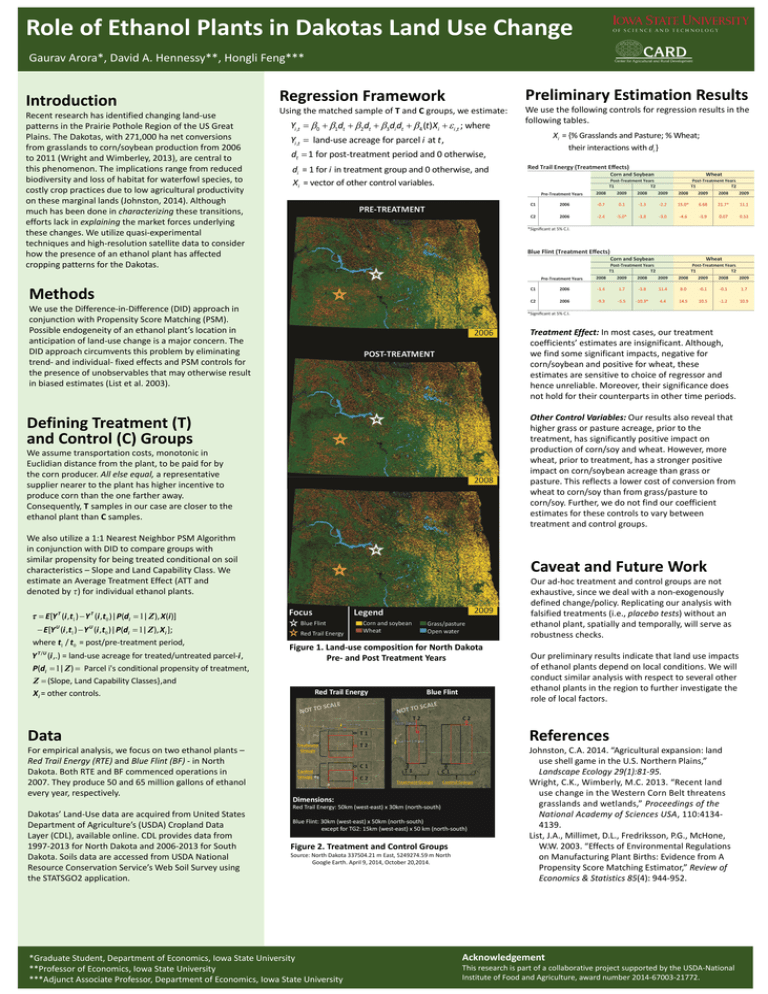
Figure 1. Land-use composition for North Dakota
Pre- and Post Treatment Years
Our preliminary results indicate that land use impacts
of ethanol plants depend on local conditions. We will
conduct similar analysis with respect to several other
ethanol plants in the region to further investigate the
role of local factors.
Data
References
For empirical analysis, we focus on two ethanol plants –
Red Trail Energy (RTE) and Blue Flint (BF) - in North
Dakota. Both RTE and BF commenced operations in
2007. They produce 50 and 65 million gallons of ethanol
every year, respectively.
Johnston, C.A. 2014. “Agricultural expansion: land
use shell game in the U.S. Northern Plains,”
Landscape Ecology 29(1):81-95.
Wright, C.K., Wimberly, M.C. 2013. “Recent land
use change in the Western Corn Belt threatens
grasslands and wetlands,” Proceedings of the
National Academy of Sciences USA, 110:41344139.
List, J.A., Millimet, D.L., Fredriksson, P.G., McHone,
W.W. 2003. “Effects of Environmental Regulations
on Manufacturing Plant Births: Evidence from A
Propensity Score Matching Estimator,” Review of
Economics & Statistics 85(4): 944-952.
Dakotas’ Land-Use data are acquired from United States
Department of Agriculture’s (USDA) Cropland Data
Layer (CDL), available online. CDL provides data from
1997-2013 for North Dakota and 2006-2013 for South
Dakota. Soils data are accessed from USDA National
Resource Conservation Service’s Web Soil Survey using
the STATSGO2 application.
Figure 2. Treatment and Control Groups
Source: North Dakota 337504.21 m East, 5249274.59 m North
Google Earth. April 9, 2014, October 20,2014.
*Graduate Student, Department of Economics, Iowa State University
**Professor of Economics, Iowa State University
***Adjunct Associate Professor, Department of Economics, Iowa State University
Acknowledgement
This research is part of a collaborative project supported by the USDA-National
Institute of Food and Agriculture, award number 2014-67003-21772.

