 Fatima Adam
Research Skills 6 : Introduction to analysing data
Session Summary You will need to begin to acquire and develop data analysis skills now in Year 1, as in Year 2 you will be asked to analyse published data for various assignments and more importantly in Year 3, you will need to analyse the data from your own projects and experiments. If you take up a scientific career, you will need to analyse published data, and analyse your own experiments. If you take up a clinical career, you will need to analyse published clinical trial data, and analyse your own clinical studies. An understanding of statistical analysis will also help you set up experiments logically from the start, which makes post-analysis easier. This session is the start of our journey through biomedical science statistics. In this session we will explain how to describe your data, how to determine the central tendency, and how to analyse how variable or how much spread there is in your data. Learning Outcomes At the end of this session you should be able to define and understand the following: methods of summarising data - the frequency tables, histograms and box plots the measures of central tendency - the mean, median and the mode the mean and standard deviation to describe the spread of the data
-
What is a population?
Description: The collection of items under discussion or observation.
Characteristics: Can be finite or infinite, real or hypothetical.
Examples: Objects, events, hospital visits, procedures, observations, measurements, or actual populations of people, animals, etc.
-
What are variates and variables?
Definition: Explain the difference between variates and variables.
Variates: What are variates, and how do they differ from variables?
Variables: What is the definition of a variable, and how are they used in data analysis?
-
What are cases in data analysis?
Definition: Define cases and their role in data collection.
Example: Provide an example of cases in a data collection scenario.
-
What are observations?
Definition: Describe what constitutes an observation in data analysis.
Example: Give an example of observations in a dataset.
-
What are quantitative variables?
Definition: Explain the characteristics of quantitative variables.
Examples: Provide examples of quantitative variables.
-
What are the types of quantitative variables?
Continuous: Describe continuous variables and provide examples.
Discrete: Explain discrete variables and give examples.
-
What are qualitative variables?
Definition: Define qualitative variables and their characteristics.
Examples: Give examples of qualitative variables.
-
What are the types of qualitative variables?
Nominal: Define nominal variables and provide examples.
Ordinal: Explain ordinal variables and give examples.
Dichotomous: Describe dichotomous variables and provide examples.
-
What is a constant in data analysis?
Definition: Define a constant and its role in data analysis.
Examples: Give examples of constants in data analysis.
-
Why are the differences between variates, variables, and constants important?
Significance: Explain the importance of understanding the differences between variates, variables, and constants in data analysis.
-
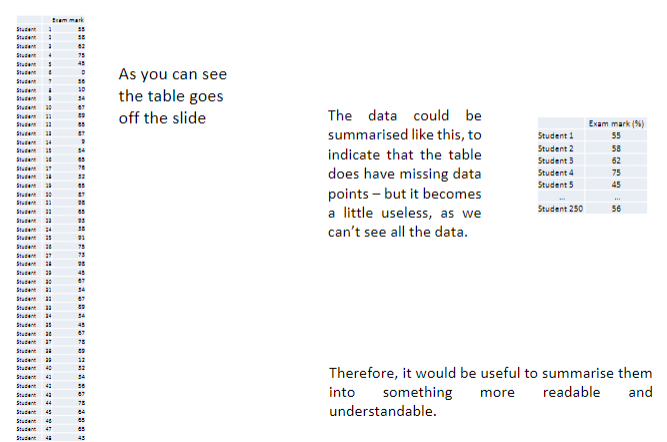
What is the purpose of summarizing complex data?
Description: Explain why summarizing complex data is necessary in data analysis.
Challenges: What challenges arise when dealing with large quantities of data?
Example: Provide an example scenario where summarizing complex data is essential.
-
How can complex data be summarized effectively?
Methods: Describe methods for summarizing complex data.
Visualization: How can data visualization aid in summarization?
Accessibility: Why is it important for summarized data to be readable and understandable?
-
What are some common techniques for summarizing complex data?
Techniques: Explain common techniques such as aggregation, summarization tables, and visual representations.
Benefits: What are the benefits of using these techniques?
Applications: Provide examples of how these techniques can be applied in data analysis scenarios.
-
Picture demonstrating a results table with missing data:
-
What is a frequency table?
Definition: Define a frequency table and its purpose in data analysis.
Function: Explain how a frequency table summarizes data.
Example: Provide an example of a frequency table using student exam results.
-
How is a frequency table created?
Grouping: Describe the process of grouping data in a frequency table.
Interval Selection: How are intervals selected for grouping?
Information Loss: Discuss the trade-off between information loss and gaining an overview of data trends.
-
What insights can be gained from a frequency table?
Trend Analysis: How does a frequency table help in identifying trends in the data?
Most Common Values: What can we learn from the most frequent values in the table?
Interpretation: How do analysts interpret the information presented in a frequency table?
-
What is a histogram?
Definition: Explain what a histogram is and how it visualizes data.
Representation: Describe how data is represented in a histogram.
Purpose: Discuss the purpose of using histograms in data analysis.
-
How is a histogram created?
Data Bins: Explain the concept of data bins or intervals in a histogram.
Frequency: How is the frequency of each data bin represented in a histogram?
Bar Heights: Describe how the height of bars in a histogram is determined.
-
Interpreting a histogram
Data Distribution: How can you interpret the distribution of data from a histogram?
Central Tendency: What insights can be gained about the central tendency of data from a histogram?
Outliers: How are outliers identified in a histogram?
-
Interpreting Skewed Data in a Histogram
Skewness: Define skewness and its significance in data distribution.
Types of Skewness: Explain the difference between left-skewed, right-skewed, and symmetrical distributions.
Identifying Skewness: How can you identify skewness in a histogram?
Skewed to the Right: Describe what it means for data to be skewed to the right and how it's reflected in a histogram.
-
Understanding Data Peaks in a Histogram
Peak Interpretation: Discuss how peaks in a histogram represent data concentrations.
Highest Frequency Range: Explain the significance of the highest frequency range (60-70%) in the histogram.
Uniformity: Address the lack of uniformity in the data distribution across percentage groups.
-
Analysing Distribution Patterns
Overall Distribution: Analyze the overall distribution pattern of the data in the histogram.
Central Peak: Discuss the central peak and its implications for data interpretation.
Effect on Interpretation: How does skewness affect the interpretation of data trends in a histogram?
-
What is the concept of summarizing a dataset with a single number and the measures of central tendency?
Single Number Summary: Explain the concept of summarizing a dataset with a single number.
Central Tendency: Define central tendency as the middle or central value of a dataset.
Various Methods: Discuss different methods for determining the center of a dataset.
Statistical Tools: Introduce statistical tools used to measure central tendency, such as mean, median, and mode.
-
Define the mean, median and mode and its significance in statistics:
Mean: Define the mean as the average of all values in the dataset.
Median: Define the median as the middle value when the data is arranged in ascending or descending order.
Mode: Define the mode as the most frequently occurring value in the dataset.
Usage and Interpretation: Explain when each measure of central tendency is most appropriate and how to interpret their values.

