What is a population?
Description: The collection of items under discussion or observation.
Characteristics: Can be finite or infinite, real or hypothetical.
Examples: Objects, events, hospital visits, procedures, observations, measurements, or actual populations of people, animals, etc.
What are variates and variables?
Definition: Explain the difference between variates and variables.
Variates: What are variates, and how do they differ from variables?
Variables: What is the definition of a variable, and how are they used in data analysis?
What are cases in data analysis?
Definition: Define cases and their role in data collection.
Example: Provide an example of cases in a data collection scenario.
What are observations?
Definition: Describe what constitutes an observation in data analysis.
Example: Give an example of observations in a dataset.
What are quantitative variables?
Definition: Explain the characteristics of quantitative variables.
Examples: Provide examples of quantitative variables.
What are the types of quantitative variables?
Continuous: Describe continuous variables and provide examples.
Discrete: Explain discrete variables and give examples.
What are qualitative variables?
Definition: Define qualitative variables and their characteristics.
Examples: Give examples of qualitative variables.
What are the types of qualitative variables?
Nominal: Define nominal variables and provide examples.
Ordinal: Explain ordinal variables and give examples.
Dichotomous: Describe dichotomous variables and provide examples.
What is a constant in data analysis?
Definition: Define a constant and its role in data analysis.
Examples: Give examples of constants in data analysis.
Why are the differences between variates, variables, and constants important?
Significance: Explain the importance of understanding the differences between variates, variables, and constants in data analysis.
What is the purpose of summarizing complex data?
Description: Explain why summarizing complex data is necessary in data analysis.
Challenges: What challenges arise when dealing with large quantities of data?
Example: Provide an example scenario where summarizing complex data is essential.
How can complex data be summarized effectively?
Methods: Describe methods for summarizing complex data.
Visualization: How can data visualization aid in summarization?
Accessibility: Why is it important for summarized data to be readable and understandable?
What are some common techniques for summarizing complex data?
Techniques: Explain common techniques such as aggregation, summarization tables, and visual representations.
Benefits: What are the benefits of using these techniques?
Applications: Provide examples of how these techniques can be applied in data analysis scenarios.
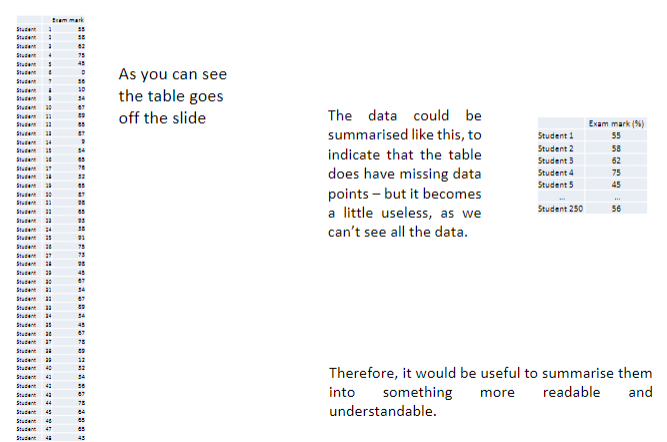
Picture demonstrating a results table with missing data:

What is a frequency table?
Definition: Define a frequency table and its purpose in data analysis.
Function: Explain how a frequency table summarizes data.
Example: Provide an example of a frequency table using student exam results.
How is a frequency table created?
Grouping: Describe the process of grouping data in a frequency table.
Interval Selection: How are intervals selected for grouping?
Information Loss: Discuss the trade-off between information loss and gaining an overview of data trends.
What insights can be gained from a frequency table?
Trend Analysis: How does a frequency table help in identifying trends in the data?
Most Common Values: What can we learn from the most frequent values in the table?
Interpretation: How do analysts interpret the information presented in a frequency table?
What is a histogram?
Definition: Explain what a histogram is and how it visualizes data.
Representation: Describe how data is represented in a histogram.
Purpose: Discuss the purpose of using histograms in data analysis.
How is a histogram created?
Data Bins: Explain the concept of data bins or intervals in a histogram.
Frequency: How is the frequency of each data bin represented in a histogram?
Bar Heights: Describe how the height of bars in a histogram is determined.
Interpreting a histogram
Data Distribution: How can you interpret the distribution of data from a histogram?
Central Tendency: What insights can be gained about the central tendency of data from a histogram?
Outliers: How are outliers identified in a histogram?
Interpreting Skewed Data in a Histogram
Skewness: Define skewness and its significance in data distribution.
Types of Skewness: Explain the difference between left-skewed, right-skewed, and symmetrical distributions.
Identifying Skewness: How can you identify skewness in a histogram?
Skewed to the Right: Describe what it means for data to be skewed to the right and how it's reflected in a histogram.
Understanding Data Peaks in a Histogram
Peak Interpretation: Discuss how peaks in a histogram represent data concentrations.
Highest Frequency Range: Explain the significance of the highest frequency range (60-70%) in the histogram.
Uniformity: Address the lack of uniformity in the data distribution across percentage groups.
Analysing Distribution Patterns
Overall Distribution: Analyze the overall distribution pattern of the data in the histogram.
Central Peak: Discuss the central peak and its implications for data interpretation.
Effect on Interpretation: How does skewness affect the interpretation of data trends in a histogram?
What is the concept of summarizing a dataset with a single number and the measures of central tendency?
Single Number Summary: Explain the concept of summarizing a dataset with a single number.
Central Tendency: Define central tendency as the middle or central value of a dataset.
Various Methods: Discuss different methods for determining the center of a dataset.
Statistical Tools: Introduce statistical tools used to measure central tendency, such as mean, median, and mode.
Define the mean, median and mode and its significance in statistics:
Mean: Define the mean as the average of all values in the dataset.
Median: Define the median as the middle value when the data is arranged in ascending or descending order.
Mode: Define the mode as the most frequently occurring value in the dataset.
Usage and Interpretation: Explain when each measure of central tendency is most appropriate and how to interpret their values.