37 cards
 Jac0074, Tinycards Lover
MSC 385 Supply Chain Test 2
All terms added; problem instructions and/or tips may be added next; Version 10 Kartka.ai link: https://app.kartka.ai/shared/decks/QP1Ntv4KuLUJkWDmcgLpgNmW
-
Effect of reducing variation in a productmore consistency and higher quality
-
How control charts' upper and lower control limits are determinedby the natural variation in the process
-
How process capability's upper and lower control limits are determinedby customer specifications
-
Fact about binding constraintseach has a shadow price
-
Types of Quality ToolsFishbone diagrams, flowcharts, histograms, process capability, check sheets, Pareto charts, scatter plots, line charts, control charts, and run charts
-
Appraisal costsCosts of activities designed to ensure quality or uncover defects
-
Prevention costsAll TQ training, TQ planning, customer assessment, process control, and quality improvement costs to prevent defects from occurring
-
Internal failure costsCosts incurred to fix problems that are detected before the product/service is delivered to the customer
-
External failure costsAll costs incurred to fix problems that are detected after the product/service is delivered to the customer
-
X bar chartMean control charts; used to monitor a process' central tendency
-
R chartRange control charts; used to monitor the process dispersion
-
How to Interpret a Range ChartIf the points are all inside the limit, the process is in control.
-
P chartControl chart used to monitor the proportion of defectives in a process
-
C chartControl chart used to monitor the number of defects per unit
-
Fact about stable processesEven if their process control charts say they are in control they can still be incapable.
-
Quality Assurance PhasesAcceptance Sampling, Process Control, and Continuous Improvement
-
Acceptance SamplingInspection of lots before/after production
-
Process ControlInspection and corrective action during production
-
Continuous ImprovementQuality built into the process
-
Flowchart process stepRectangle
-
Plan-Do-Check-Act Cycle's inventorW. Edwards Deming
-
What to do if a process is not capableReduce variation
-
What to do if a process' CP is capable but its CPK isn'tCenter the process
-
Best Process Indicator for capabilityCP because it indicates whether the process is capable
-
Pareto Effect; important few and trivial many conceptOnly a critical few inputs have a significant impact on output; concentrate on those; 20-80 effect
-
Process improvementA systematic approach to improving a process
-
Process improvement's goalsincreasing customer satisfaction, achieving higher quality, reducing waste, reducing costs, increasing productivity, and reducing processing time
-
Transportation model assumptionsThe items to be shipped are homogeneous, shipping cost per unit is the same regardless of the number of units shipped, and there is only one route or mode of transportation being used between each origin and destination
-
Cost to ship a part from Factory 1 to Customer A

-
Cost to ship a part from Factory 2 to Customer B
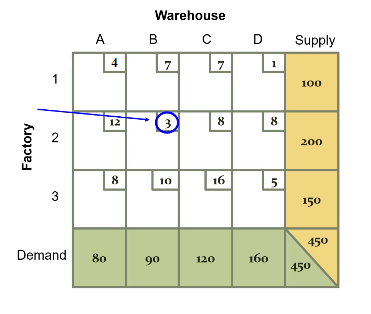
-
Numbers in the corner boxes in the transportation problemCosts
-
Transportation Problem Supply Constraints
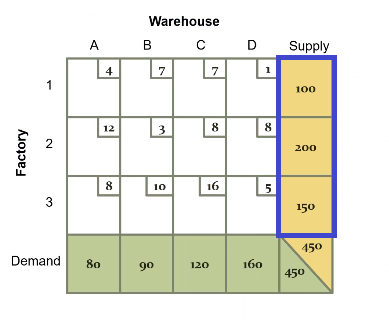
-
Transportation Problem Demand Constraints
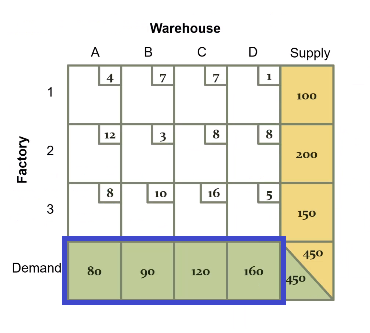
-
Transportation Problem: type of problem that uses minimizationCost Problem
-
Transportation Problem: How to write the objective function for one lineStart by writing "Min." Write the costs in front of the X's, write the factory number as the first digit in the X's subscript, write the warehouse letter as the second digit in the X's subscript, and separate the variables with plus signs.
-
Transportation Problem: How to write the objective function for the entire gridStart by writing "Min." Separate each line with a plus sign, either written before or after the line.
-
Allowable increaseamount to which the objective coefficient in question could increase and the decision variables will still be optimal

