 Fatima Adam
Linkage Analysis (Genomics)
Linkage Analysis This lecture is designed to teach you the basic principles of linkage analysis and how it is used to identify Mendelian disease genes. To start, we will review the mechanisms of genetic variation and why it is important. Next, we will look at the genetic concepts that are important for linkage analysis, i.e. homologous recombination and independent assortment. Finally, you will be shown different genotyping methods used for linkage analysis and how statistical analysis can be applied to generate a LOD (logarithm of the odds) score. Learning Outcomes On successful completion of the lecture, students should be able to: Explain homologous recombination and genetic linkage Describe how genetic disease can be classified by the number of genes required to cause the disease Describe the difference between genetic maps and physical maps of the genome Describe the principles of linkage analysis and why it is useful Describe the differences between the two types of genetic marker routinely used in linkage studies Briefly describe the genotyping technologies used in linkage analysis Describe what a haplotype is and how it is built Briefly describe the statistical approaches used in linkage analysis, with specific emphasis on the logarithm of the odds (LOD) score Summarise how linkage analysis can be combined with whole exome sequencing to identify a disease-causing variant
-
What is genetic variation, and what are its causes? (3)
Genetic variation refers to differences in the DNA sequence between individuals in a population.
Variation can be inherited or arise from environmental factors, such as drug exposure or radiation.
Genetic variation can affect the amino acid sequence of proteins, gene regulation, physical appearance (e.g., eye color, disease risk), or have silent/no apparent effects.
-
What are the mechanisms of genetic variation? (3)
Mutation: Changes in the DNA sequence that can result in genetic variation (<1%).
Polymorphism: Variations in the DNA sequence that are common within a population (≥1%).
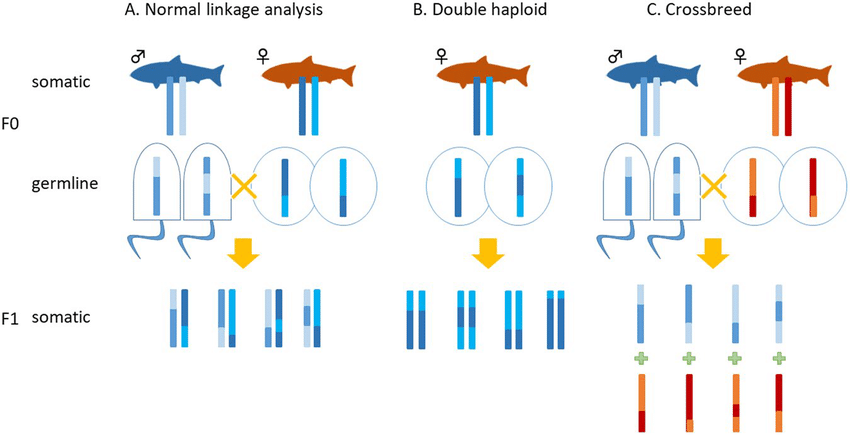
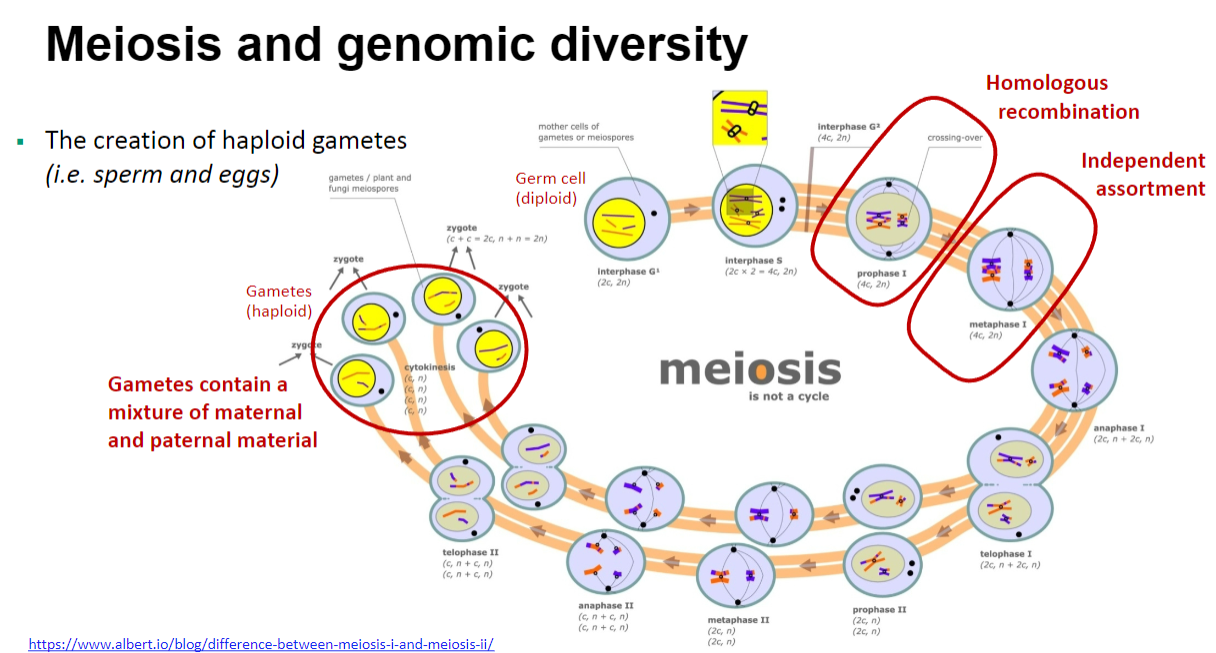
Meiotic mechanisms: Homologous recombination and independent assortment during meiosis create diverse genetic combinations.
-
What is the difference between Mendelian (monogenic) and Complex (polygenic) diseases? (2)
Mendelian diseases are caused by mutations in a single gene (monogenic), while complex diseases are influenced by multiple genes and environmental factors (polygenic).
Linkage analysis is typically used for Mendelian diseases, whereas association analysis is often used for complex diseases.
-
What are genetic maps and physical maps? (2)
Genetic maps are based on the frequency of recombination between markers and provide a relative position of genes.
Physical maps represent the actual physical distance between genes on a chromosome, measured in base pairs.
-
What are haplotypes, and how are they used in linkage analysis? (2)
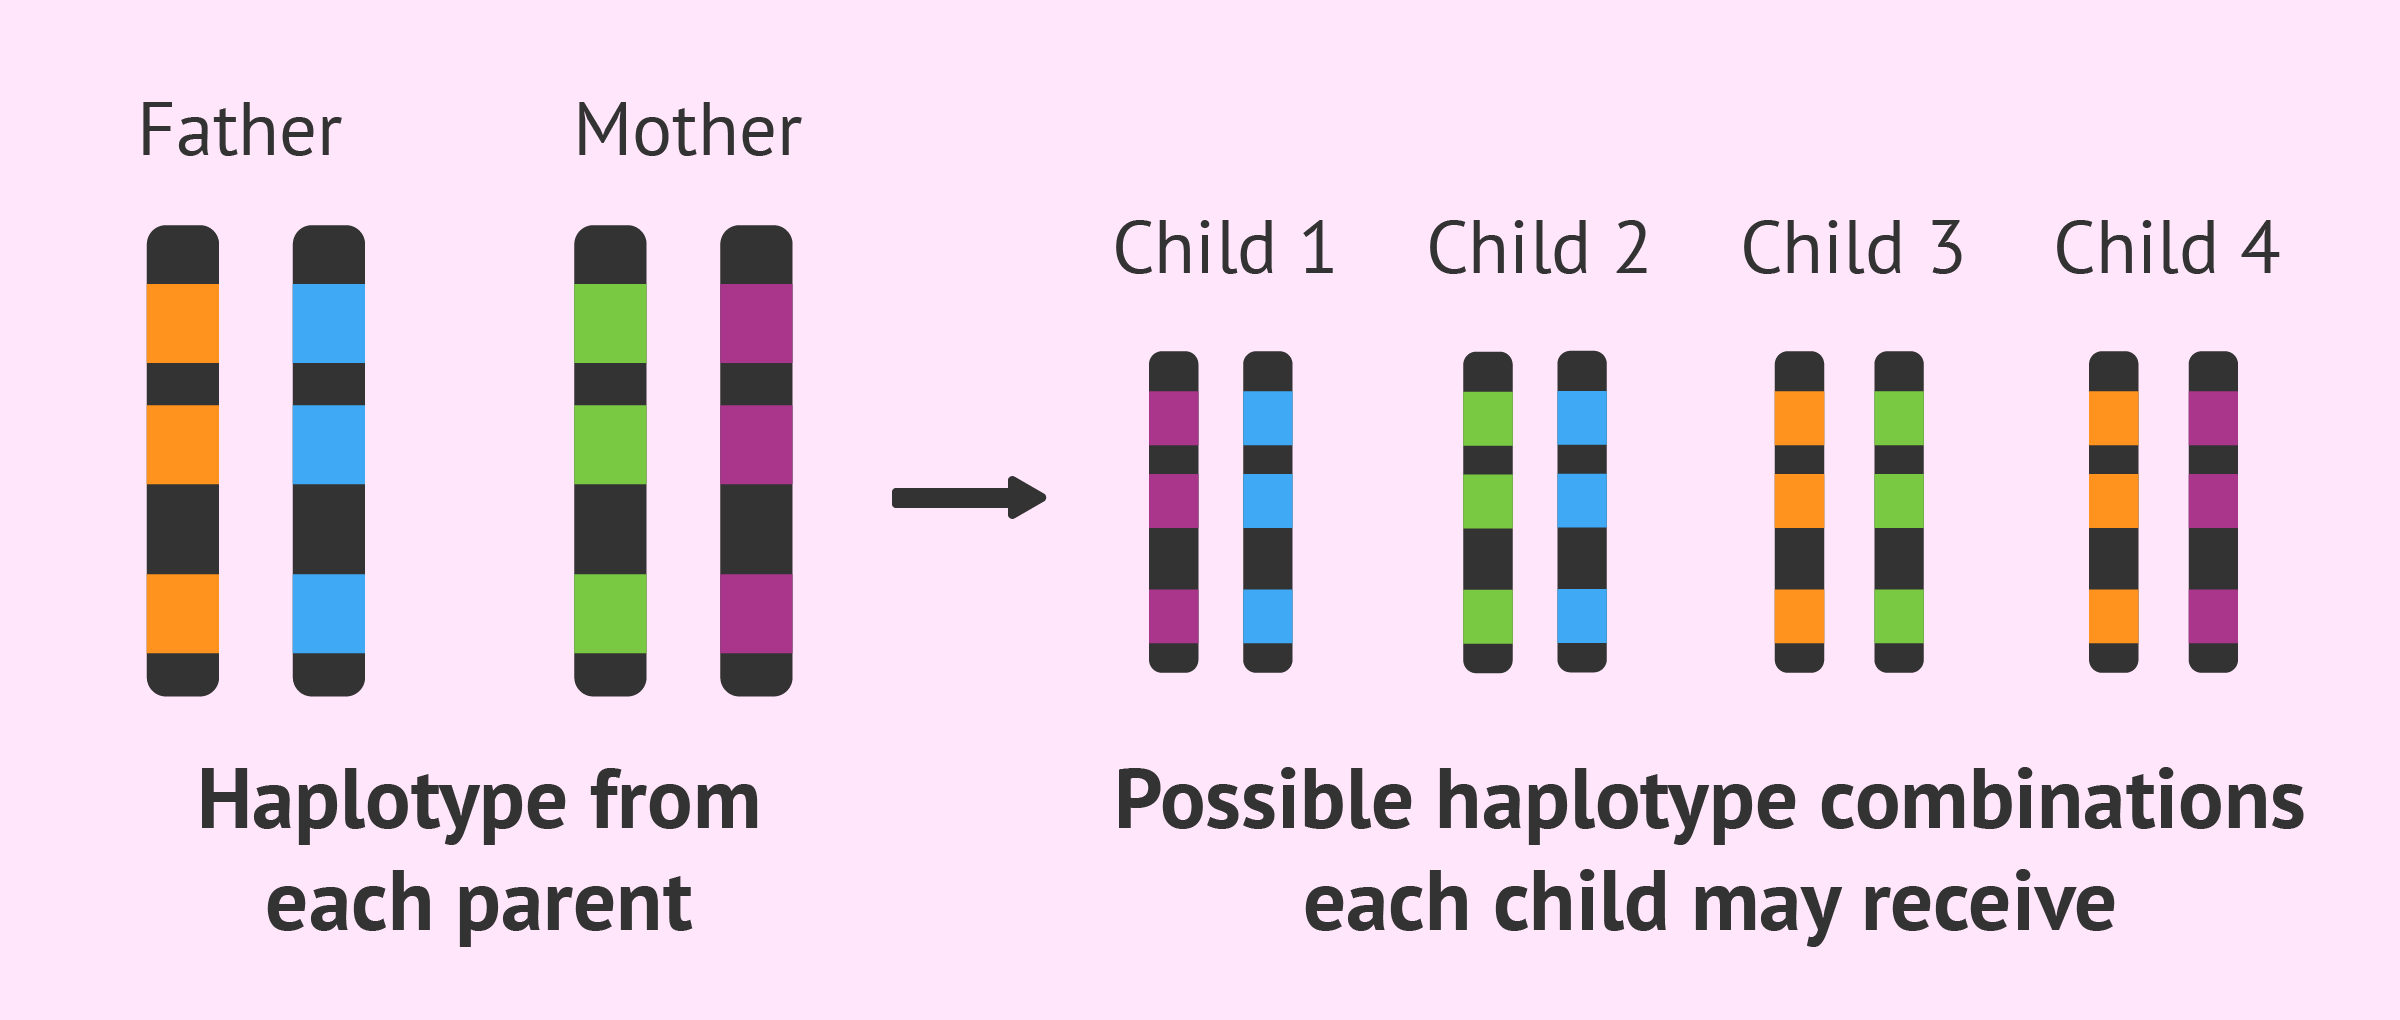
Haplotypes are combinations of alleles at multiple loci that are inherited together from a single parent.
They are used in pedigree analysis to track the inheritance of genetic traits and help identify genetic markers associated with diseases.
-
What statistical approaches are used in linkage analysis? (1)
LOD (Logarithm of the Odds) scores are generated through statistical approaches to assess the likelihood of linkage between genetic markers and traits in pedigree analysis.
-
What is homologous recombination and its significance? (3)
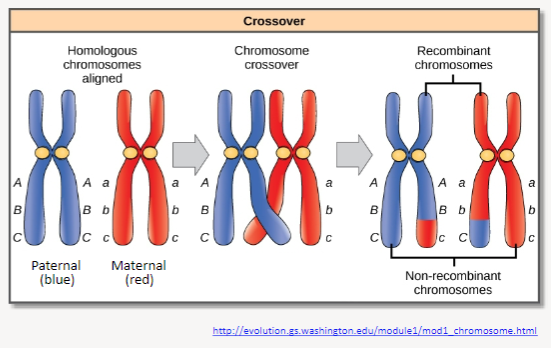
Definition: Homologous recombination involves crossing over, which is the reciprocal breaking and re-joining of homologous chromosomes during meiosis.
Result: This process results in the exchange of chromosome segments between homologous chromosomes.
Significance: It leads to new allele combinations, increasing genetic diversity within a population and contributing to evolution.
-
Picture demonstrating Meiosis and genomic diversity:
-
What are key genetic terms and their definitions? (6)
Genotype: The complete set of genes or alleles in an organism, which determines potential traits or characteristics.
Phenotype: The observable traits or characteristics of an organism, influenced by the genotype and environmental factors.
Alleles: Alternative forms of a gene found at the same locus on homologous chromosomes.
Inheritance: The process by which an organism receives two alleles for each characteristic, one from each parent; these alleles can be identical (homozygous) or different (heterozygous).
Homozygous Genotype: A genotype with identical alleles for a specific locus.
Heterozygous Genotype: A genotype with two different alleles for a specific locus.
Haplotype: A set of alleles on a single chromosome that are inherited together from one parent
-
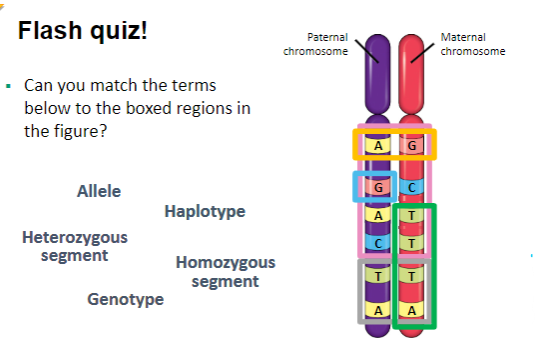
Can you match the terms
below to the boxed regions in
the figure?

-
What is the difference between homozygosity and heterozygosity? (3)
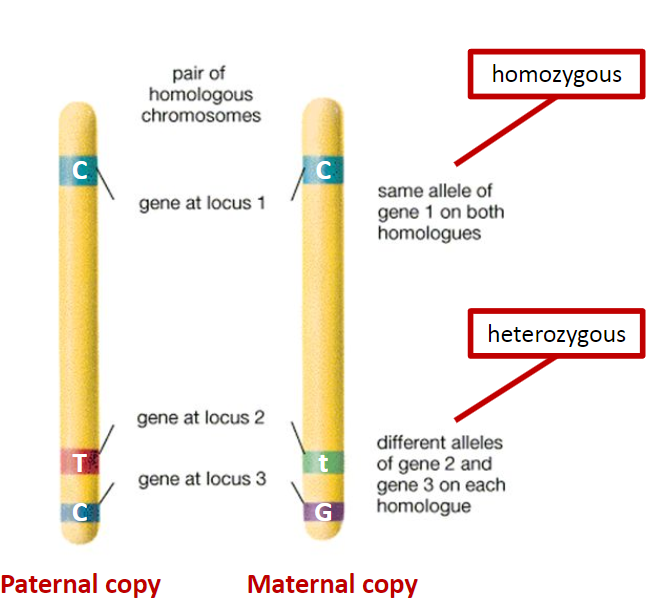
Chromosome Pair: Homozygosity and heterozygosity refer to the alleles at the same loci on homologous chromosomes.
Homozygosity: If the alleles at a given locus are the same, the individual is homozygous for that trait.
Heterozygosity: If the alleles at a given locus are different, the individual is heterozygous for that trait.
-
What are the classifications of genetic diseases? (3)
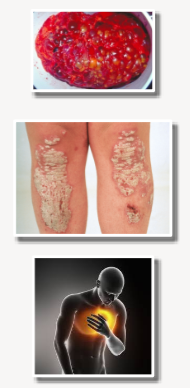
Mendelian/Monogenic: Diseases caused by a single gene with little or no environmental influence (e.g., Polycystic Kidney Disease (PKD)).
Non-Mendelian/Polygenic/Complex: Diseases or traits resulting from the cumulative effect of many different genes, each contributing a small individual impact (e.g., psoriasis).
Multifactorial: Diseases or traits that arise from the interaction of multiple genes and often involve multiple environmental factors (e.g., heart disease).
-
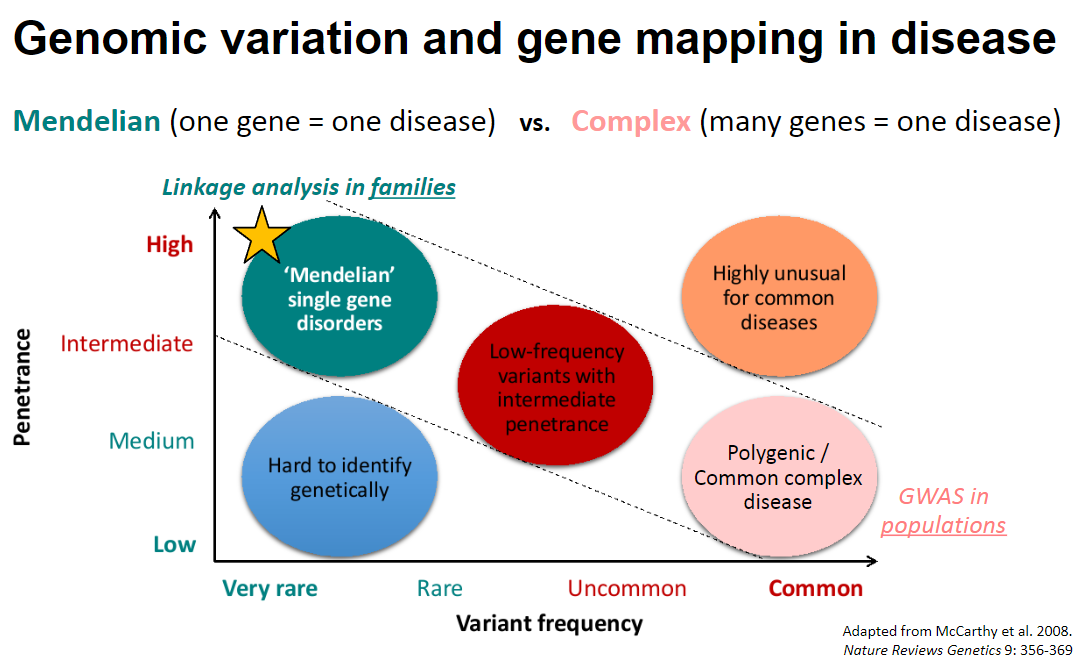
What are the characteristics of rare genetic diseases in relation to their genetic classification? (4)

Monogenic Diseases: Rare genetic diseases are typically monogenic, meaning they are caused by a single gene.
Single Gene Impact: In monogenic diseases, one gene corresponds to one disease, often due to a single rare variant with a significant effect on protein function.
Polygenic Diseases: Complex diseases, on the other hand, are polygenic, meaning they involve many genes contributing to one disease.
Common Variants: These complex diseases are caused by the cumulative impact of common variants, each exerting a small effect on the overall condition.
-
Picture demonstrating Genomic variation and gene mapping in disease:
-
What is linkage analysis? (3)
Definition: Linkage analysis is a method used to map the location of a disease gene within the genome.
Linkage Concept: The term 'linkage' refers to the assumption that two genetic elements are physically linked to each other.
Purpose: This technique helps in identifying the chromosomal location of genes associated with specific diseases, aiding in genetic research and diagnosis.
-
What are the assumptions of linkage analysis? (3)
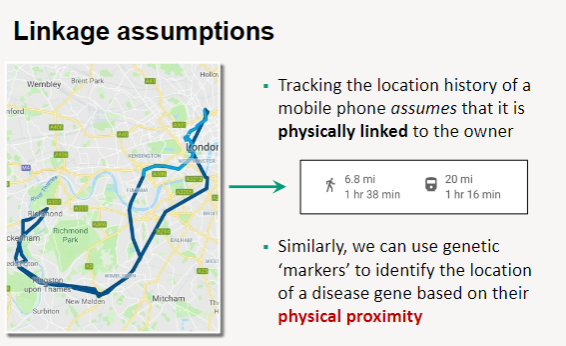
Physical Linkage: Linkage analysis assumes that genetic markers are physically linked to each other, similar to how a mobile phone is linked to its owner.
Tracking Location: Just as the location history of a mobile phone can be tracked based on its connection to the owner, genetic markers can track the location of a disease gene.
Proximity Utilization: By using genetic markers that are in close physical proximity to a disease gene, researchers can identify and map the gene's location within the genome.
-
What is the importance of maps in navigation? (3)
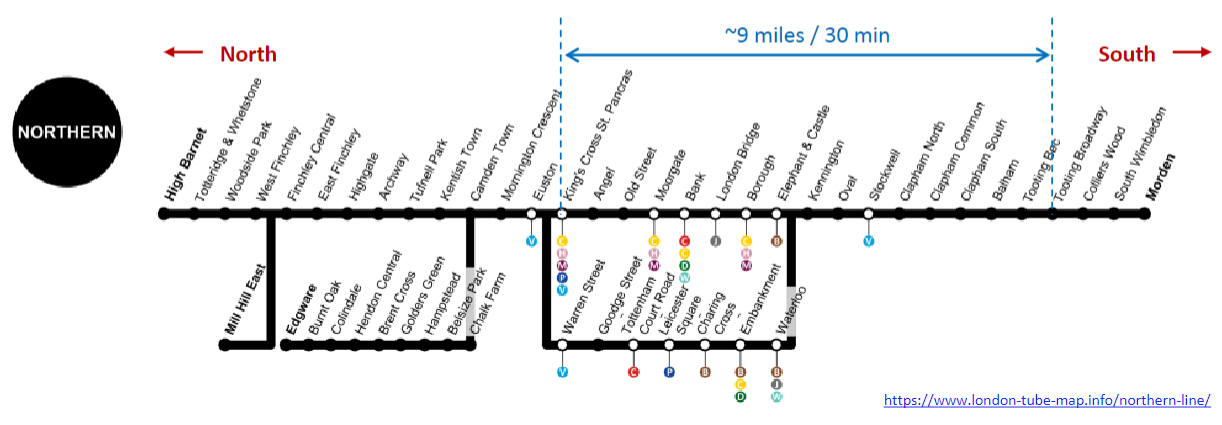
Contextual Orientation: Maps provide context, helping individuals orient themselves within a space and understand their surroundings.
Distance Calculation: They allow users to calculate the distance between landmarks, facilitating efficient navigation.
Reference Points: For example, tube stations serve as reference points or ‘landmarks’ that aid in navigating through a city.
-
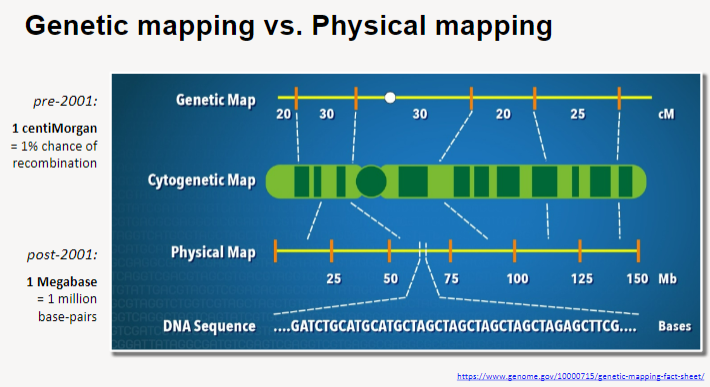
What is the difference between genetic mapping and physical mapping? (3)
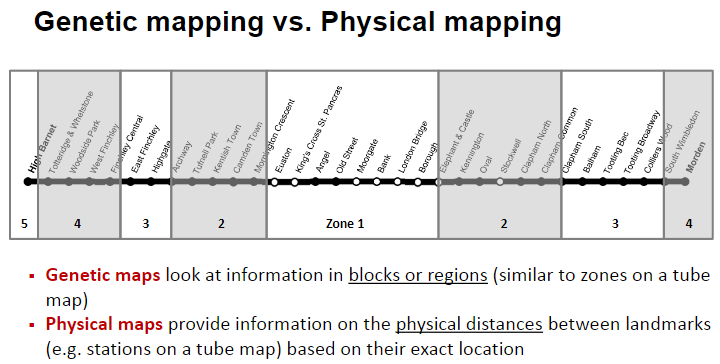
Genetic maps focus on information in blocks or regions, similar to zones on a tube map.
Physical maps provide information on the physical distances between landmarks, similar to stations on a tube map.
Genetic maps describe the relative position of genes, while physical maps provide precise location data.
-
What are the principles of genetic linkage? (4)
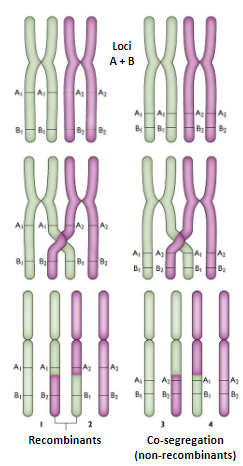
Genetic linkage refers to the tendency for alleles at neighbouring loci to segregate together during meiosis.
Crossovers are more likely to occur between loci that are separated by some distance than between loci that are close together on the chromosome.
For two loci to be linked, they must lie very close together on the chromosome.
A haplotype defines multiple alleles at linked loci, and these chromosomal segments can be tracked through pedigrees and populations.
-
What are the principles of genetic linkage in relation to gene and marker distance? (3)
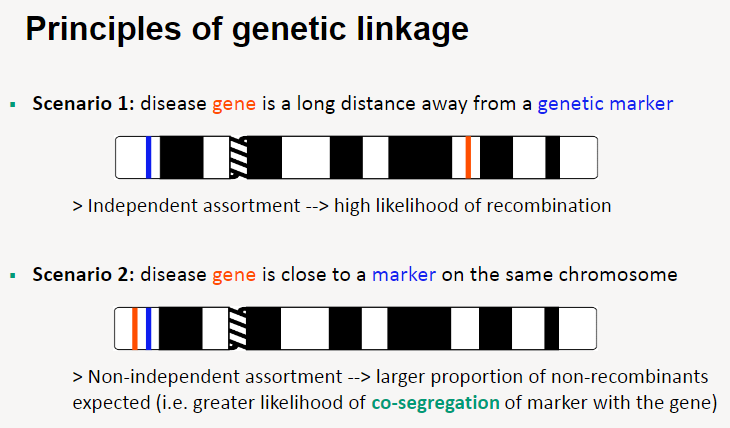
Scenario 1: Disease gene far from a genetic marker
Independent assortment occurs, leading to a high likelihood of recombination.
Scenario 2: Disease gene close to a genetic marker
Non-independent assortment occurs, resulting in a larger proportion of non-recombinants.
This leads to a greater likelihood of co-segregation of the marker with the gene.
-
What are the methods of linkage analysis? (5)
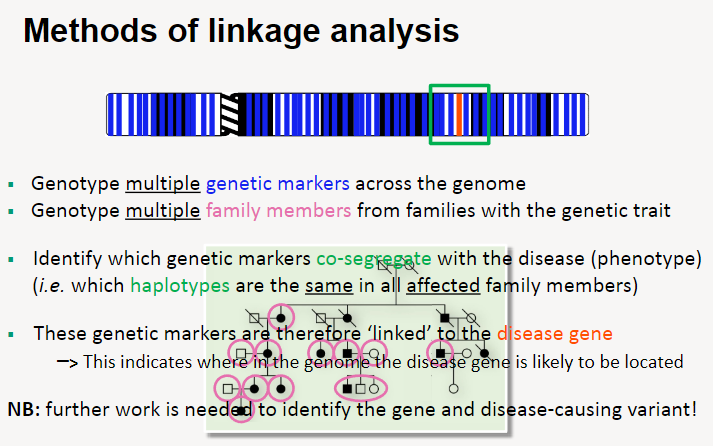
Genotype multiple genetic markers across the entire genome.
Genotype family members, particularly those with the genetic trait or disease.
Identify which genetic markers co-segregate with the disease phenotype (i.e., markers that are inherited together with the disease in affected individuals).
Genetic markers that consistently co-segregate with the disease are considered linked to the disease-causing gene.
This linkage analysis helps pinpoint the general region of the genome where the disease gene is located, but further research is required to identify the specific gene and variant responsible.
-
What is genetic variation and how does it affect phenotypes? (2)
Genetic variation can lead to different phenotypic effects or may be silent with no observable effect.
Mutations causing Mendelian (monogenic) diseases are typically rare, whereas polymorphisms are common in the population.
-
What is the role of homologous recombination in meiosis? (2)
Homologous recombination during meiosis results in the exchange of chromosome segments.
This process leads to new allele combinations in the offspring.
-
What is the role of linkage analysis in Mendelian disease gene localization? (2)
Linkage analysis is a powerful method for localizing a Mendelian disease gene to a specific region of the genome.
Polymorphic genetic markers can be used to identify regions of the genome that are co-segregating with the disease or phenotype.
-
What are microsatellite markers and their characteristics? (5)
Microsatellites are highly polymorphic short tandem repeats of 2 to 6 base pairs (bp).
They may differ in length between chromosomes (heterozygous).
Microsatellites are relatively widely spaced apart in the genome.
400 (200) microsatellite markers with an average spacing of 9 cM (20 cM).
PCR-based system using fluorescently-labelled primers for manual genotype assignment, which is labour-intensive and takes >2-3 months for a whole genome scan.
-
What are single nucleotide polymorphisms (SNPs) and their characteristics? (5)
SNPs are the genetic marker of choice, being biallelic (each SNP has two possible base options).
They have lower heterozygosity compared to microsatellites, but are spaced much closer together in the genome.
SNPs are more informative than microsatellites.
~6,000 SNPs spaced throughout the genome.
Microarray-based system with automated genotype assignment. Highly automated, with data returned in <1-2 months. SNPs are typically labelled in the style "rs2943645" (refer to the NCBI dbSNP database for details).
-
What are the typical uses of microsatellite genotyping? (4)
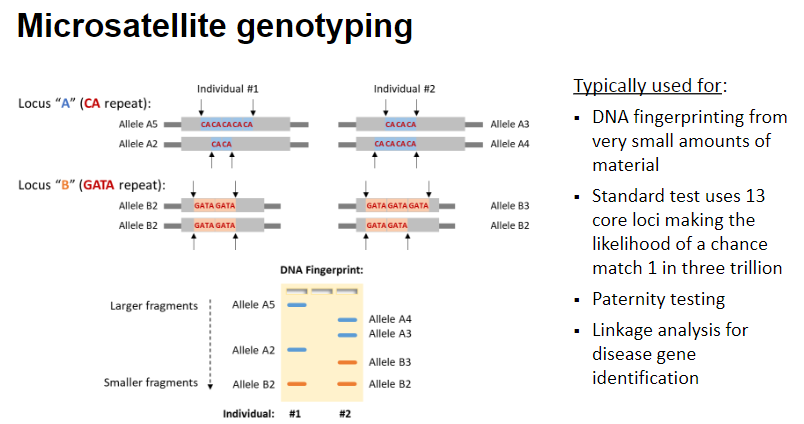
DNA fingerprinting from very small amounts of material.
The standard test uses 13 core loci, making the likelihood of a chance match 1 in three trillion.
Paternity testing to confirm biological relationships.
Linkage analysis for disease gene identification.
-
What are the characteristics and applications of fluorescent genotyping? (4)
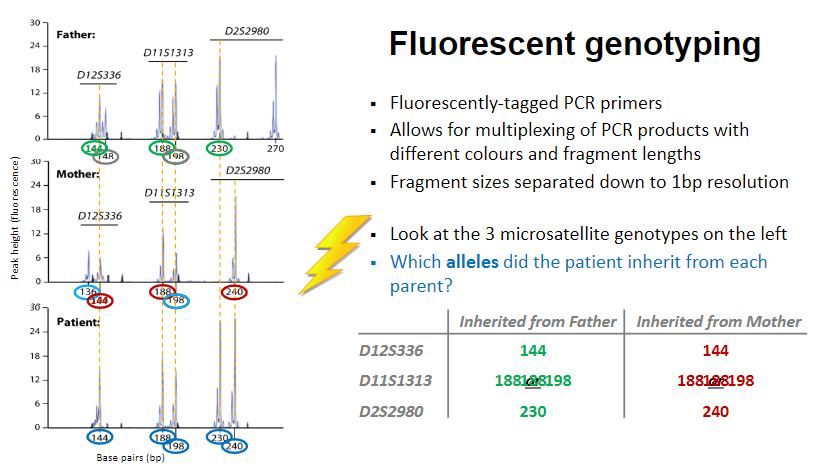
Uses fluorescently-tagged PCR primers for DNA amplification.
Allows for multiplexing (multianalysis of dna samples simultaneously) of PCR products, using different colours and fragment lengths for analysis.
Fragment sizes are separated with 1bp resolution for precise identification.
Genotyping of microsatellites involves identifying which alleles the patient inherited from each parent by examining the fluorescent signals.
-
What is a single nucleotide polymorphism (SNP) and its characteristics? (4)
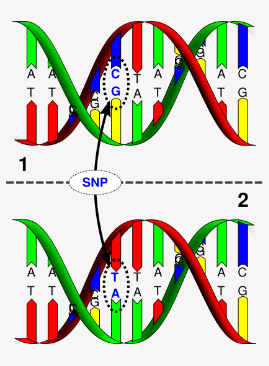
An SNP involves a single base change, such as CCT → CTT (Proline to Leucine).
It is the most common type of genetic variation.
SNPs are thought to occur approximately 1 per 1,000 bases in the genome.
The human genome consists of 3 billion base pairs (2 x 3,000 Mb).
-
What are SNP genotyping arrays and their features? (4)

SNP genotyping arrays provide genome-wide coverage of SNP markers.
SNPs are proxy markers, meaning they are not the causal disease variants but are used to track disease-associated genes.
These arrays can amplify thousands of markers in a single experiment.
Alleles are identified by relative fluorescence:
Homozygous for allele 1 = green signal.
Homozygous for allele 2 = red signal.
Heterozygous (1/2) = yellow signal.
-
What are the typical applications of SNP genotyping arrays? (4)
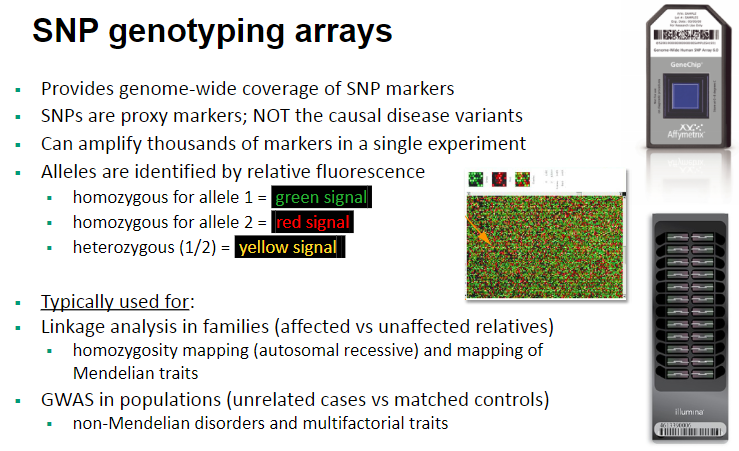
Linkage analysis in families (affected vs unaffected relatives).
Homozygosity mapping for autosomal recessive diseases and mapping of Mendelian traits.
GWAS (Genome-Wide Association Studies) in populations (unrelated cases vs matched controls).
Analysis of non-Mendelian disorders and multifactorial traits.
-
What is microsatellite coverage in human genome studies? (2)

Example of microsatellite coverage: A panel developed by the Centre for Inherited Disease Research (CIDR).
Microsatellites help analyze specific regions of the genome, but gaps exist, particularly in centromeres and telomeres (represented by black areas).
-
What is SNP coverage in human genome studies? (3)
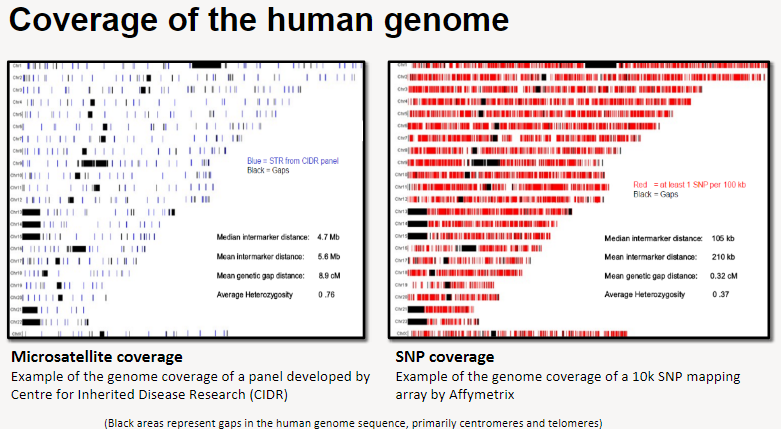
Example of SNP coverage: A 10k SNP mapping array developed by Affymetrix.
The array provides coverage of specific regions across the genome, but gaps still exist, primarily in the centromeres and telomeres (represented by black areas).
These SNP arrays help analyze genetic variation across different individuals.
-
What is linkage mapping using genetic markers? (2)
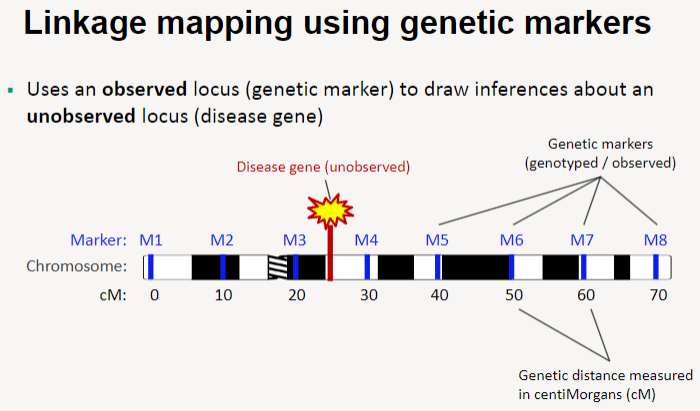
Linkage mapping uses an observed locus (genetic marker) to draw inferences about an unobserved locus (such as a disease gene).
This method helps identify the location of disease genes by analyzing their relationship with known genetic markers.
-
How does linkage mapping using genetic markers work? (4)
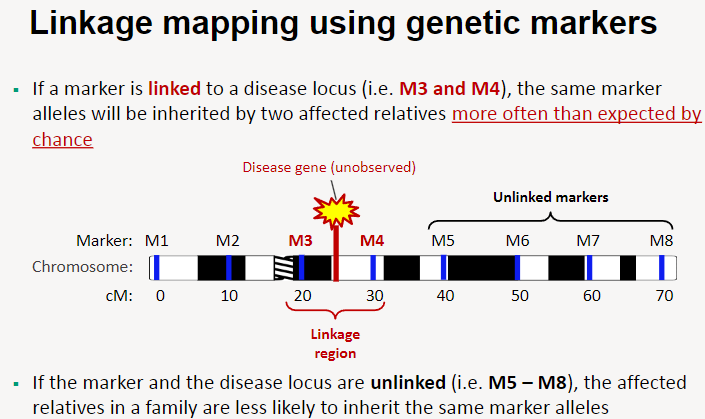
If a marker is linked to a disease locus (e.g. M3 and M4), the same marker alleles will be inherited by two affected relatives more often than expected by chance.
If the marker and disease locus are unlinked (e.g. M5 and M8), the affected relatives in a family are less likely to inherit the same marker alleles.
Linkage regions are identified based on the inheritance patterns of markers in families with the disease.
This method helps narrow down the location of the disease gene by tracking marker inheritance.
-
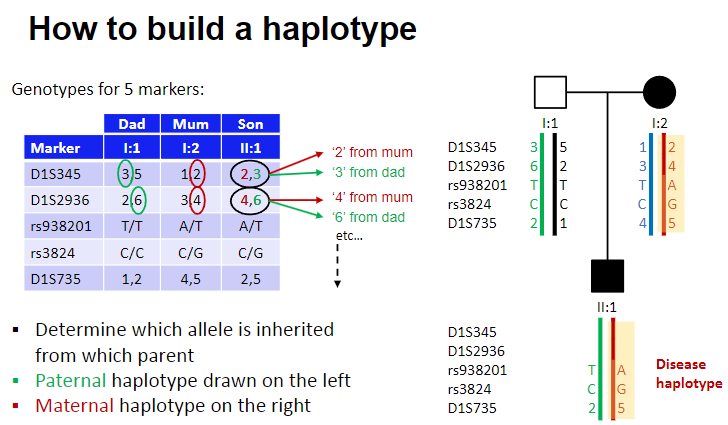
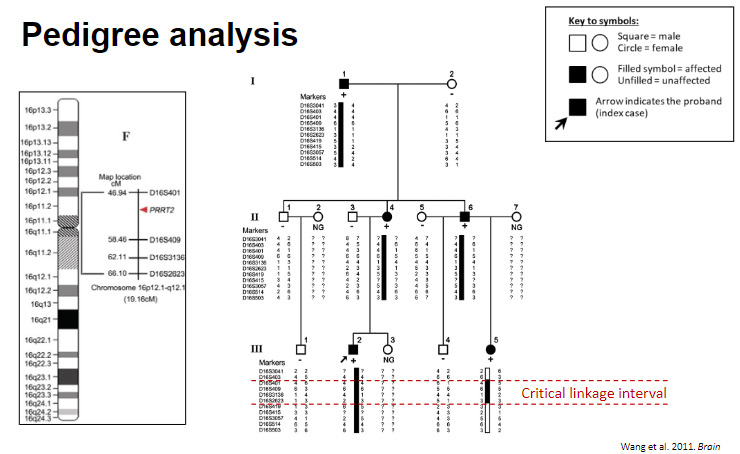
How do you build a haplotype? (3)
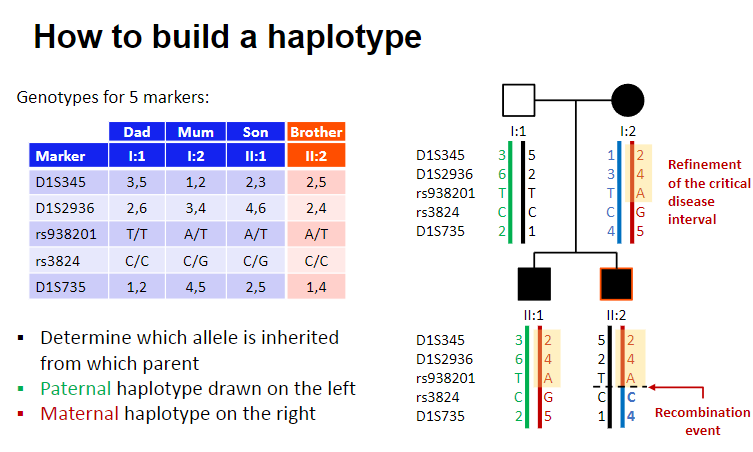
Determine which allele is inherited from each parent.
Paternal haplotype is drawn on the left.
Maternal haplotype is drawn on the right.
-
Picture demonstrating Pedigree analysis:
-
How is statistical analysis of linkage performed using a LOD score? (6)
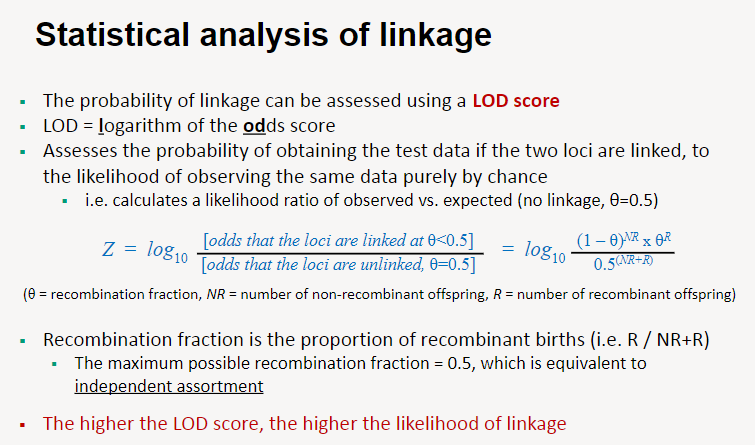
A LOD score (logarithm of the odds score) is used to evaluate the likelihood that two loci are linked.
It compares the probability of the observed data if the loci are linked to the probability of the data if there is no linkage (independent assortment, θ = 0.5).
The LOD score is calculated as the logarithm of the likelihood ratio: observed data under linkage vs. expected data under no linkage.
The recombination fraction (θ) represents the proportion of recombinant offspring, calculated as θ=RNR+R\theta = \frac{R}{NR + R}θ=NR+RR, where R = recombinants and NR = non-recombinants.
When θ = 0.5, it indicates independent assortment (maximum recombination). Lower θ values suggest tighter linkage.
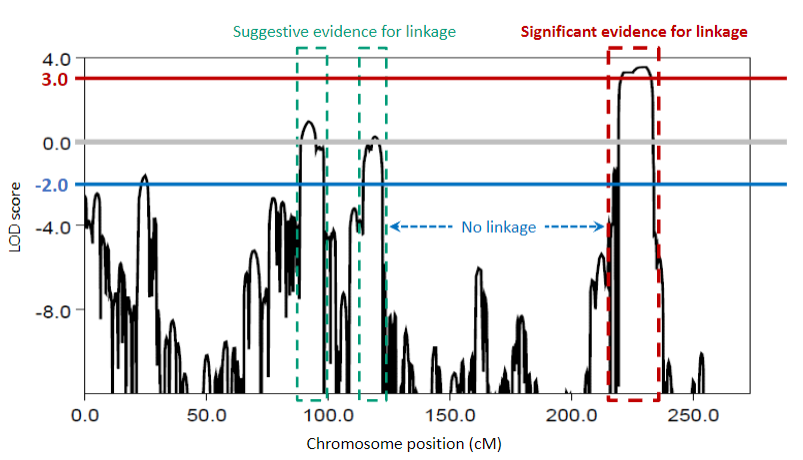
A higher LOD score indicates stronger evidence for linkage, typically considered significant if it exceeds 3.
-
How are LOD scores used in statistical analysis of linkage? (7)

LOD scores can be calculated across the whole genome using genotype data for many genetic markers in multiple family members.
Parametric analysis specifies the pedigree structure and inheritance pattern (model).
Non-parametric analysis detects allele sharing between affected individuals.
LOD scores are additive: Different families linked to the same disease locus will increase the overall score.
A LOD score ≥ 3 is considered evidence for linkage.
A LOD score of 3 is equivalent to odds of 1000:1 that the observed linkage occurred by chance.
A LOD score ≤ -2 is considered evidence against linkage.
-
Picture demonstrating LOD scores:
-
What are some different linkage software available and how do they perform analysis? (5)
Linkage software options include: Vitesse, PLINK, MERLIN, Alohomora, Fastlink, and others.
Parametric analysis in these programs specifies analysis parameters, such as:
Inheritance pattern
Disease allele frequency
Penetrance
Non-parametric analysis:
No parameters are specified.
Focuses on allele sharing between affected individuals.
-
What is the summary of linkage analysis methods? (8)
Linkage analysis localizes a Mendelian disease gene to a specific region of the genome.
Genetic markers (e.g., microsatellites, SNPs) identify regions co-segregating with the phenotype.
Microsatellites are highly polymorphic but have poor genome coverage.
SNPs offer denser coverage but are less polymorphic.
Linkage software uses haplotype analysis to assess recombination and define the critical linkage interval.
LOD scores are calculated from genotype data.
A LOD score of ≥ 3 indicates statistical significance for linkage.
A LOD score of ≤ -2 indicates evidence against linkage.
-
What is a review of linkage analysis methods? (7)
Linkage analysis localizes a Mendelian disease gene to a specific region of the genome.
Used in families with autosomal dominant or autosomal recessive inheritance.
Genetic markers (e.g., microsatellites, SNPs) identify regions co-segregating with the phenotype using haplotype analysis.
Statistical analysis generates a LOD score, indicating the likelihood of co-segregation due to linkage vs. chance.
A LOD score of ≥ 3 indicates genome-wide statistical significance for linkage.
A LOD score of ≤ -2 indicates evidence for exclusion of linkage.
-
What is an example of mapping an autosomal dominant disease gene using linkage analysis? (6)
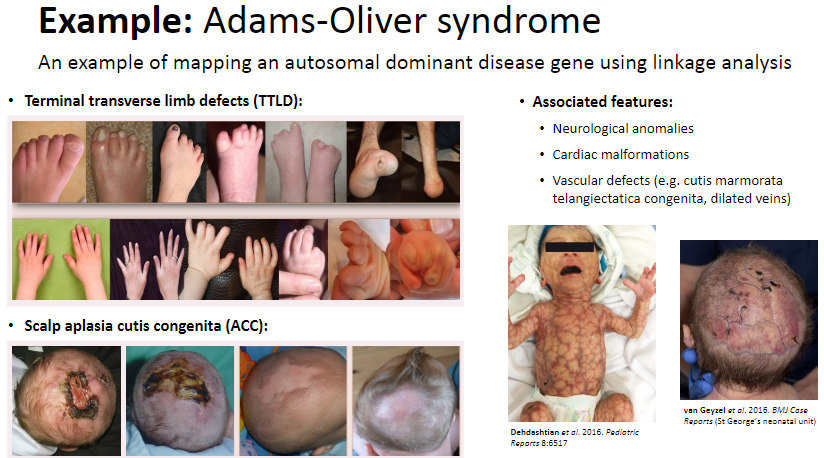
Adams-Oliver syndrome involves autosomal dominant inheritance.
Terminal transverse limb defects (TTLD) and scalp aplasia cutis congenita (ACC) are characteristic features.
Associated features include:
Neurological anomalies
Cardiac malformations
Vascular defects (e.g., cutis marmorata telangiectatica congenita, dilated veins)
-
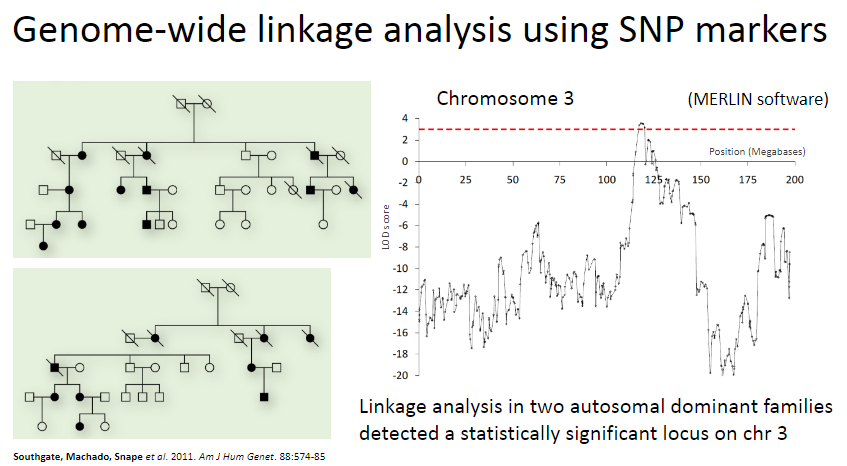
Picture demonstrating Genome-wide linkage analysis using SNP markers:
-
What is locus refinement in linkage analysis? (1)
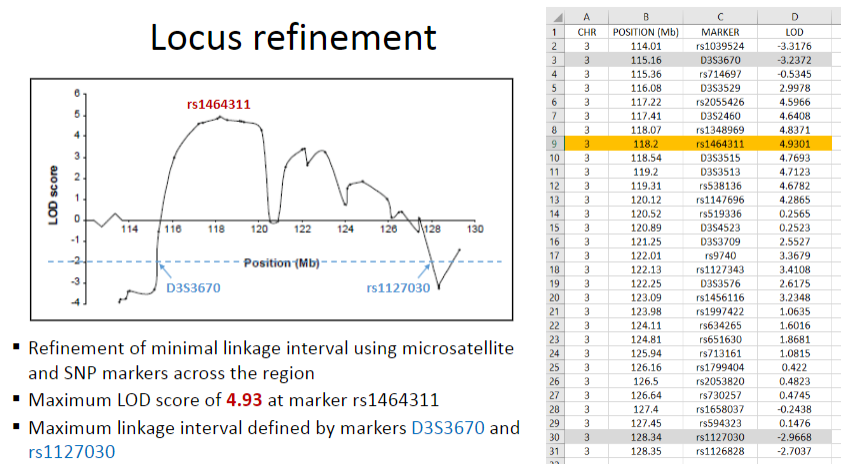
Refinement of the minimal linkage interval using microsatellite and SNP markers across the region.
-
Picture demonstrating linkage intervals:
-
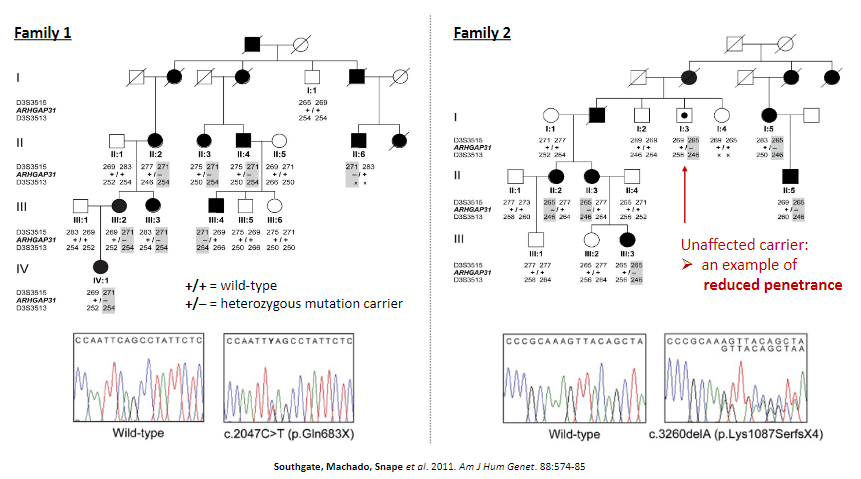
What is the significance of heterozygous mutations in the ARHGAP31 gene? (2)
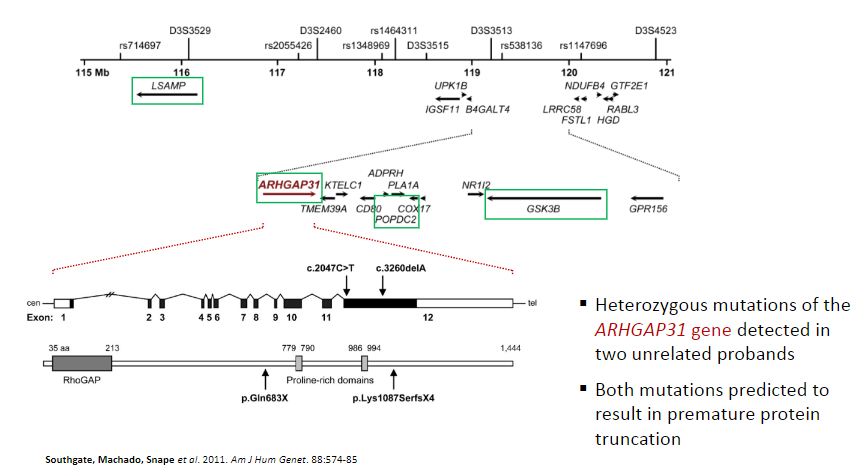
Heterozygous mutations of the ARHGAP31 gene detected in two unrelated probands.
Both mutations are predicted to result in premature protein truncation.
-
Picture demonstrating reduced penetrance:
-
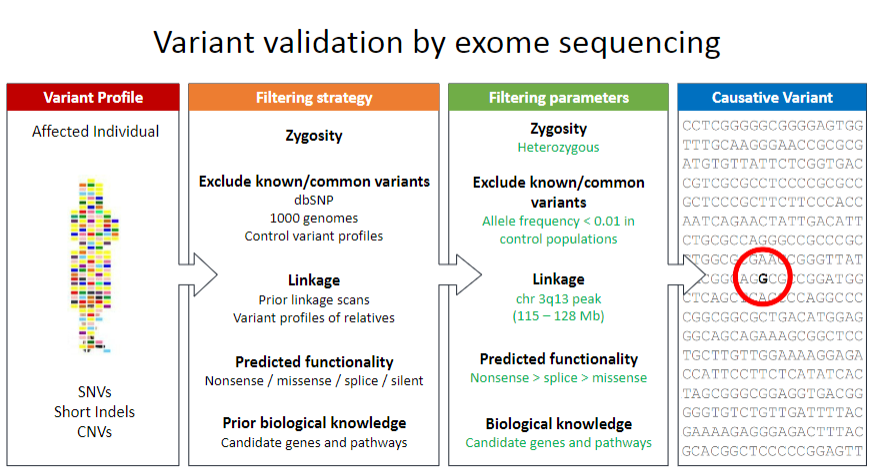
Picture demonstrating Variant validation by exome sequencing:
-
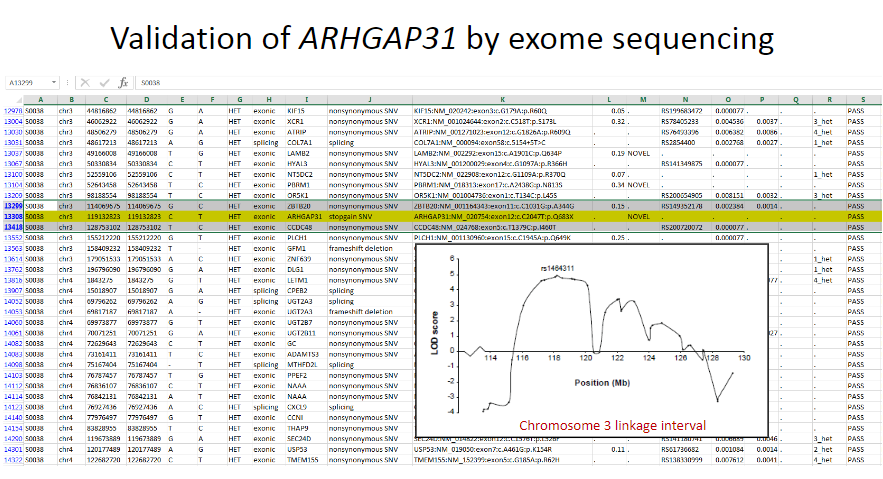
Picture demonstrating Validation of ARHGAP31 by exome sequencing:
-
What are the key steps in the linkage analysis of Adams-Oliver syndrome? (5)
Adams-Oliver syndrome is a rare, Mendelian (monogenic) disorder.
SNP markers were used to generate genome-wide genotype data for multiple individuals from two autosomal dominant families.
Linkage analysis achieved a LOD score of statistical significance on chromosome 3.
Linkage analysis can be confounded by factors like reduced penetrance, locus heterogeneity, and variable clinical expressivity.
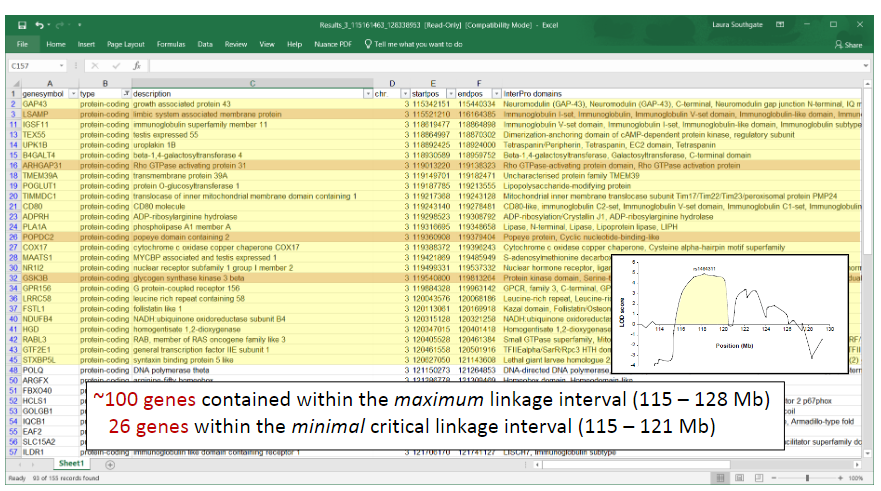
Disease-causing variants in ARHGAP31 were identified through candidate gene analysis of genes in the minimal linkage interval.

