Pre-assessment
advertisement
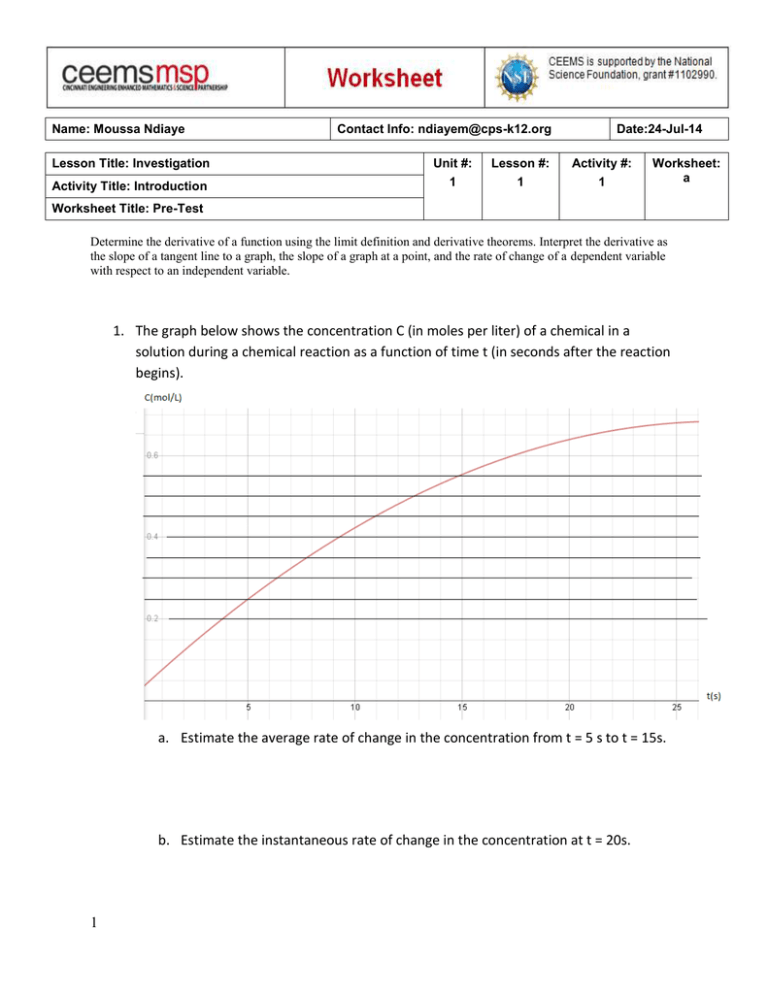
Name: Moussa Ndiaye Lesson Title: Investigation Activity Title: Introduction Contact Info: ndiayem@cps-k12.org Unit #: 1 Lesson #: 1 Date:24-Jul-14 Activity #: 1 Worksheet: a Worksheet Title: Pre-Test Determine the derivative of a function using the limit definition and derivative theorems. Interpret the derivative as the slope of a tangent line to a graph, the slope of a graph at a point, and the rate of change of a dependent variable with respect to an independent variable. 1. The graph below shows the concentration C (in moles per liter) of a chemical in a solution during a chemical reaction as a function of time t (in seconds after the reaction begins). a. Estimate the average rate of change in the concentration from t = 5 s to t = 15s. b. Estimate the instantaneous rate of change in the concentration at t = 20s. 1 Determine the derivative and higher order derivatives of a function explicitly and implicitly and solve related rates problems. 1. Find formulas for the derivatives of the following functions. Simplify your answers (if possible). 4 a. y 2 x b. y 2 x 1 2 c. y ln x 3 2 d. y e tan x e. y 2 3x 4 x2 2. An object moves as in problem 2a, with displacement, x, given by x t 3 13t 2 35t 27 where x is in feet and t is in seconds. a. Find the equation for the velocity and the acceleration. b. Find the velocity and acceleration at t = 1, t = 6, and t = 8. At each time, state i. Whether x is increasing or decreasing, and at what rate ii. Whether the object is speeding up or slowing down, and how you decided c. At what times in the interval [0, 9] is x a relative maximum? Is x ever negative if t is in this interval? 3 For problems 1-1, determine a) the intervals on which the function is increasing or decreasing, b) the x-coordinates of any relative minimum or maximum points on its graph, c) the intervals on which the function is concave up or concave down, and d) the x-coordinates of any inflection points on its graph. 1. y x 3 12 x 2 60 x 10 2. y ln( x 2 1) 4
