Page 1 Week in Review # 4 Section 2.1 Things to know:
advertisement
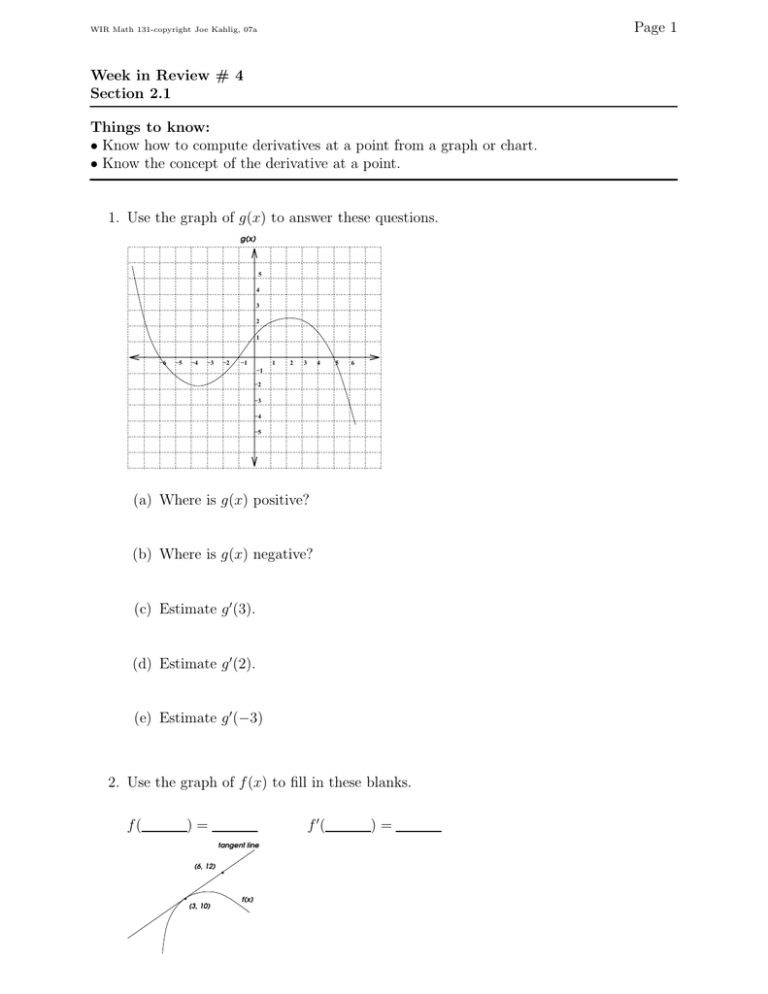
Page 1 WIR Math 131-copyright Joe Kahlig, 07a Week in Review # 4 Section 2.1 Things to know: • Know how to compute derivatives at a point from a graph or chart. • Know the concept of the derivative at a point. 1. Use the graph of g(x) to answer these questions. g(x) 5 4 3 2 1 −6 −5 −4 −3 −2 −1 1 2 4 3 5 6 −1 −2 −3 −4 −5 (a) Where is g(x) positive? (b) Where is g(x) negative? (c) Estimate g ′ (3). (d) Estimate g ′ (2). (e) Estimate g ′ (−3) 2. Use the graph of f (x) to fill in these blanks. f( )= f ′( tangent line (6, 12) (3, 10) f(x) )= Page 2 WIR Math 131-copyright Joe Kahlig, 07a 3. Use the points on the graph to answer these questions. I C D E H A B F G (a) At which points is the derivative zero? (b) At which points is the derivative positive? (c) At which points is the derivative negative? (d) At which point is the derivative the largest? (e) At which point is the derivative the least? 4. Use the table to estimate the derivatives. x 1 1.5 2 2.5 3 4 7 12 14 f(x) 1 3 6 8 12 14 25 32 42 (a) f ′ (2) = (b) f ′ (1) = (c) f ′ (7) = (d) f ′ (13) = 5. Estimate the derivative for f (x) = xx at x = 2 and at x = 5
