Gastrointestinal Outbreak Case Study
advertisement
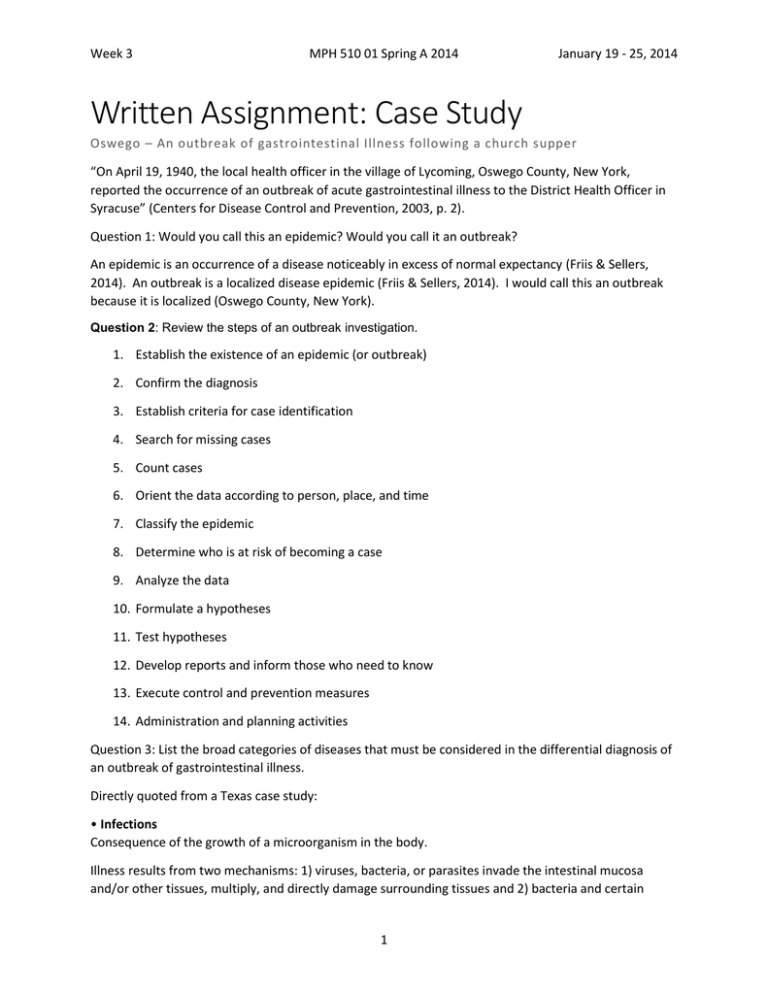
Week 3 MPH 510 01 Spring A 2014 January 19 - 25, 2014 Written Assignment: Case Study Oswego – An outbreak of gastrointestinal Illness following a church supper “On April 19, 1940, the local health officer in the village of Lycoming, Oswego County, New York, reported the occurrence of an outbreak of acute gastrointestinal illness to the District Health Officer in Syracuse” (Centers for Disease Control and Prevention, 2003, p. 2). Question 1: Would you call this an epidemic? Would you call it an outbreak? An epidemic is an occurrence of a disease noticeably in excess of normal expectancy (Friis & Sellers, 2014). An outbreak is a localized disease epidemic (Friis & Sellers, 2014). I would call this an outbreak because it is localized (Oswego County, New York). Question 2: Review the steps of an outbreak investigation. 1. Establish the existence of an epidemic (or outbreak) 2. Confirm the diagnosis 3. Establish criteria for case identification 4. Search for missing cases 5. Count cases 6. Orient the data according to person, place, and time 7. Classify the epidemic 8. Determine who is at risk of becoming a case 9. Analyze the data 10. Formulate a hypotheses 11. Test hypotheses 12. Develop reports and inform those who need to know 13. Execute control and prevention measures 14. Administration and planning activities Question 3: List the broad categories of diseases that must be considered in the differential diagnosis of an outbreak of gastrointestinal illness. Directly quoted from a Texas case study: • Infections Consequence of the growth of a microorganism in the body. Illness results from two mechanisms: 1) viruses, bacteria, or parasites invade the intestinal mucosa and/or other tissues, multiply, and directly damage surrounding tissues and 2) bacteria and certain 1 Week 3 MPH 510 01 Spring A 2014 January 19 - 25, 2014 viruses invade and multiply in the intestinal tract and then release toxins that damage surrounding tissues or interfere with normal organ or tissue function. The necessary growth of the microorganism (for production and release of toxins) takes time; thus, the incubation periods for infections are relatively long, often measured in days compared with hours as are seen with intoxications. Symptoms of infection usually include diarrhea, nausea, vomiting, and abdominal cramps. Fever and an elevated white blood count are often associated with infection. • Intoxications Caused by ingestion of food already contaminated by toxins. Sources of toxin include certain bacteria, poisonous chemicals, and toxins found naturally in animals, plants, or fungi. Intoxications most often result from bacteria that release toxins into food during growth in the food. The preformed toxin is ingested, thus live bacteria do not need to be consumed to cause illness. Illness from a toxin manifests more rapidly than that due to an infection because time for growth and invasion of the intestinal lining is not required. The incubation period for an intoxication is often measured in minutes or hours. The most common (and sometimes only) symptom of an intoxication is vomiting. Other symptoms can range from nausea and diarrhea to interference with sensory and motor functions such as double vision, weakness, respiratory failure, numbness, tingling of the face, and disorientation. Fever is rarely present with intoxication. (Stehr-Green, 2002) Question 4: In epidemiologic parlance, what is a vehicle? What is a vector? What are other modes of transmission? direct, person-to-person contact (e.g., STDs) fomite-borne (inanimate object) (e.g., Hepatitis A spread by a contaminated eating utensil) vehicle-borne (non-living intermediary) (e.g., HIV/AIDS spread through infected blood on used hypodermic needle). Fomite is a type of vehicle. vector-borne transmission (e.g., Malaria spread through mosquitoes) Question 5: If you were to administer a questionnaire to the church supper participants, what information would you collect? Group the information into categories. According to the CDC (2013), “The pathogen causing illness, where ill persons live or how old they are may suggest the mode of transmission, and even a specific source.” I would collect a food history. I would as basic demographic questions first. I would each person what he or she ate at the event. I would also ask each person what his or her symptoms were. Whether or not he or she was hospitalized or sought medical attention. The categories would be: demographic and clinical (food history, symptoms, and medical history). Question 6: What is a line listing? What is the value of a line listing? According to the CDC’s Steps of an Outbreak Investigation: Traditionally, we collect the information described above on a standard case report form, questionnaire, or data abstraction form. We then abstract selected critical items in a table called a "line listing." In a line listing, each column represents an important variable, such as name or identification number, age, sex, and case classification, while each row represents a different case, by number. New cases are added to a line listing as they are 2 Week 3 MPH 510 01 Spring A 2014 January 19 - 25, 2014 identified. This simple format allows the investigator to scan key information on every case and update it easily. Even in the era of microcomputers, many epidemiologists still maintain a hand-written line listing of key data items and turn to their computers for more complex manipulations of data. (Centers for Disease Control and Prevention, 2004) The value of a line listing is the summarization of information. Line list are used to summarize information. Question 7: What is the value of an epidemic curve? The time course of an epidemic is shown by drawing a graph of the number of cases by their date of onset. This graph is called an epidemic curve and it gives a straightforward visual display of the outbreak's magnitude and time trend (Centers for Disease Control and Prevention, 2004). Question 8: Using the graph paper provided, graph the cases by time of onset of illness (include appropriate labels and title). What does this graph tell you? Oswego GI Illness Following a Church Supper 45 40 35 Number of cases 30 25 20 15 10 5 0 4/18/14 7:12 PM 4/18/14 9:36 PM 4/19/14 12:00 AM 4/19/14 2:24 AM 4/19/14 4:48 AM 4/19/14 7:12 AM 4/19/14 9:36 AM 4/19/14 12:00 PM Time of onset 3 Week 3 MPH 510 01 Spring A 2014 January 19 - 25, 2014 This graph tells me that most of the cases occurred on or after 12:30 a.m. The incidences occurred in the middle of the night after bedtimes. Question 9: Are there any cases for which the times of onset are inconsistent with the general experience? How might they be explained? Yes, there are cases for which the times of onset are inconsistent with the general experience. Particularly, case number 16 and 52. Case number 16 stated that the time of onset occurred on April 19th at 10:30 a.m. Furthermore, the description of the church supper stated that it began at 6:00 p.m. Case number 52, age 8, male, time of meal 11:00 a.m., date of onset 4/18, and time of onset 3:00 p.m. So how could case number 52 have eaten at 11:00 a.m.? This might be explained by all of the unknown factors (i.e., time of meal). Question 10: How could the data in the line listing be better presented? Explain more in depth about the unknown time of meal. Have more columns to indicate what type of symptoms were being experienced. Question 11: Where possible, using the new line listing, calculate incubation periods and illustrate their distribution with an appropriate graph. Incubation Period Graph 8 7 6 5 4 3 2 1 0 0 5 10 15 Question 12: Determine the range and median of the incubation period. Range = 4 AND the median = 4 hours 4 20 25 Week 3 MPH 510 01 Spring A 2014 January 19 - 25, 2014 Question 13: How does the information on incubation period, combined with the data on clinical symptoms, help in the differential diagnosis of the illness? (If necessary, refer to attached Compendium of Acute Foodborne Gastrointestinal Disease). The information on the incubation period as in this situation the median is 4 hours combined with the data on clinical symptoms which in the situation are the following: vomiting, diarrhea, nausea, and no fever, help us determine the cause. From the Compendium of Acute Foodborne Gastrointestinal Disease it appears that the church supper attendees will infected with Bacillus cereus. 5 Week 3 MPH 510 01 Spring A 2014 January 19 - 25, 2014 Vanilla ice cream is the vehicle with 54 individuals consuming it and the majority of those ill ate vanilla ice cream. 6 Week 3 MPH 510 01 Spring A 2014 January 19 - 25, 2014 Question 15: Outline further investigations that should be pursued. Possibly start to use analytic epidemiology. “With this method, you test your hypotheses by using a comparison group to quantify relationships between various exposures and the disease. There are two types of analytic studies: cohort studies and case-control studies. Cohort studies compare groups of people who have been exposed to suspected risk factors with groups who have not been exposed. Casecontrol studies compare people with a disease (case-patients) with a group of people without the disease (controls). The nature of the outbreak determines which of these studies you will use” (Centers for Disease Control and Prevention, 2004). Question 16: What control measures would you suggest? One control measure that I would suggest is refrigeration implementation, if you could contact the church directly. I would definitely inform the church and make all of the vanilla ice cream was disposed of. If you were to perform or consider more evaluation of your hypothesis, you could perform a case control study. “Conceptually, the controls must not have the disease in question, but should be from the same population as the case-patients. In other words, they should be similar to the case-patients except that they do not have the disease. Common control groups consist of neighbors and friends of case-patients and people from the same physician practice or hospital as case-patients. In general, the more case-patients and controls you have, the easier it will be to find an association. Often, however, you are limited because the outbreak is small. For example, in a hospital, 4 or 5 cases may constitute an outbreak. Fortunately, the number of potential controls will usually be more than you need. In an outbreak of 50 or more cases, 1 control per case-patient will usually suffice. In smaller outbreaks, you might use 2, 3, or 4 controls per case-patient. More than 4 controls per case-patient will rarely be worth your effort.” (Centers for Disease Control and Prevention, 2004) Question 17: Why was it important to work up this outbreak? It was important to work up this outbreak to see descriptive epidemiology in action. To learn how to investigate an outbreak. Question 18: Refer to the steps of an outbreak investigation you listed in Question 2. How does this investigation fit that outline? This investigation fits that outline almost point by point. 7 Week 3 MPH 510 01 Spring A 2014 January 19 - 25, 2014 References: Centers for Disease Control and Prevention. (2003). Oswego – An outbreak of gastrointestinal illness following a church supper. (Case Study Student Guide No. 401-303). New York State Department of Public Health Division: CDC-EIS. Retrieved from http://www.cdc.gov/eis/casestudies/xoswego.401-303.student.pdf Centers for Disease Control and Prevention. (2004, November 17). EXCITE Epidemiology in the Classroom Outbreak Steps. Retrieved January 26, 2014, from http://www.cdc.gov/excite/classroom/outbreak/steps.htm Centers for Disease Control and Prevention. (2013, November 12). Generating Hypotheses Investigations Investigating Outbreaks Foodborne Outbreaks Food Safety. Retrieved January 25, 2014, from http://www.cdc.gov/foodsafety/outbreaks/investigatingoutbreaks/investigations/sources.html Friis, R. H., & Sellers, T. A. (2014). Epidemiology for Public Health Practice. Jones & Bartlett Publishers. Stehr-Green, J. K. (2002, April). Gastroenteritis at a University in Texas INSTRUCTOR’S VERSION. Centers for Disease Control and Prevention. Retrieved from www.cdc.gov/.../xfdz_gas_i.doc 8

