Is the Transport of Atlantic Water in the Faroe Shetland Channel
changing? – A summary of 20 years of observations
Bee Berx1, Bogi Hansen2, Svein Østerhus3, Karin Margaretha Larsen2,
Toby Sherwin4 and Kerstin Jochumsen5
1 Marine
Scotland Science (b.berx@marlab.ac.uk); 2 Faroe Marine Research Institute; 3 University of Bergen;
Association for Marine Science; 5 Universität Hamburg
4 Scottish
Ocean Sci., 9, 639-654, 2013
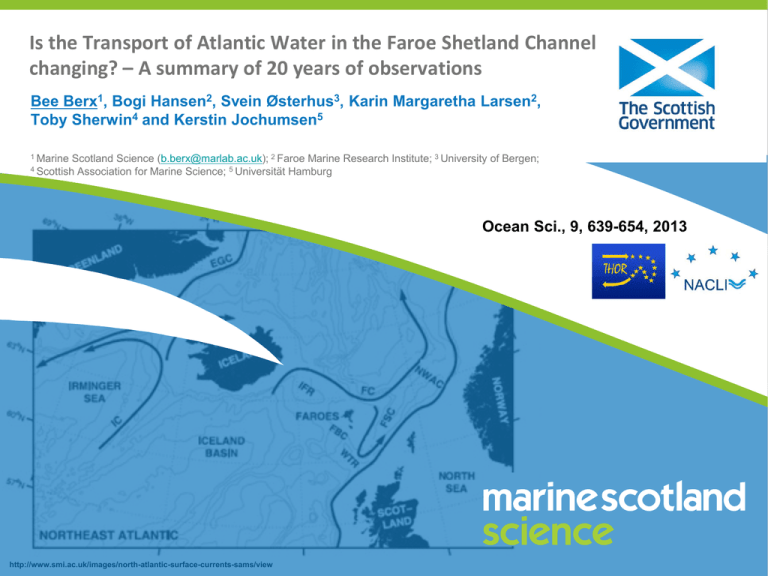
http://www.smi.ac.uk/images/north-atlantic-surface-currents-sams/view
Why are we interested in the
Faroe Shetland Channel (FSC)?
Circulation in the Faroe Shetland Channel
Atlantic
Water
NAW
MNAW
Intermediate
Water
MEIW
NSAIW
Deep
Water
NSDW
Circulation in the Faroe Shetland Channel
Atlantic
Water
NAW
MNAW
Atlantic
Water is
defined
as
warmer
than
5°C.
Observing Circulation in the FSC
Temperature and Salinity in the FSC
on the FIM section
How to estimate Atlantic Water transport in
the Faroe Shetland Channel?
The assumption of geostrophy
[where large ocean currents are an equilibrium of the pressure gradient and Coriolis]
allows us to convert sea level height measurements into
current speeds.
SEOS Project
Regression of Atlantic Water velocities from the
current meter against sea surface height allows
estimation of altimetry-based AW velocity.
Average volume, relative heat and salt
transports in the FSC
1 Sv = 106 m3 s-1
NE
SW
Net (Atl.
Inflow)
Surface-to-bottom
3.5 Sv
-3.1 Sv
0.4 Sv
Warmer than 5°C
3.5 Sv
-0.8 Sv
2.7 Sv
Colder than 5°C
0.0 Sv
-2.3 Sv
-2.3 Sv
Relative Heat Transport
131 TW
-24 TW
107 TW
Salt Transport
125x106 kg s-1
-27x106 kg s-1
98x106 kg s-1
© All rights reserved by
Thomas_Ashley (via Flickr)
Net (Atl. Inflow)
1 OSSP = 1 Olympic Size Swimming Pool
Surface-to-bottom (OSSP)
Warmer than 5°C (OSSP)
Colder than 5°C (OSSP)
Relative Energy Transport (Mars)
Salt Transport (Gritter)
DAF Gritter
(CPD Engineering)
1 standard Mars
bar (58g)
~160
~1,100
~940
~100 million
~9700
Transport of Atlantic water in the FSC
6
Altimetry
ADCP
Volume Transport (Sv)
5
4
3
2
1
0
Jan-98
Jan-00
Jan-02
Jan-04
Jan-06
Jan-08
Jan-10
Seasonal cycle in volume transport
6
Seasonal amplitude
of Atlantic water
transport in FSC
~ 0.7-0.9 Sv
Monthly Avg. ADCP-Tr.
Seas. Fit ADCP
Avg. Alt.-Tr
5
Volume Transport (Sv)
Std. Alt.Tr
Seas. Fit Alt.
4
This is ~ 25% of the
average transport
3
Maximum transport
in winter-time, lowest
transport in summer.
2
Different amplitude
based on calculation
method
1
0
Jan
Mar
May
Jul
Sep
Nov
Transport of Atlantic Water
in the FSC 1992-2012
5
Volume Transport (Sv)
4.5
4
3.5
3
2.5
2
1.5
1
0.5
Jan-92 Jan-94 Jan-96 Jan-98 Jan-00 Jan-02 Jan-04 Jan-06 Jan-08 Jan-10
No long term trend !
5.5
Conclusions
•
•
•
•
•
•
Combined temperature and salinity measurements with current
meter and sea elevation observations to estimate transport of
Atlantic water through the FSC.
On average 2.7±0.5 Sv is transported into the Nordic Seas.
Although variable, the net volume transport shows consistent
seasonality with maximum Dec-Jan, and an amplitude of 0.7 Sv.
No significant long-term trend in volume transport between 1992
and 2011.
We have observed increases in temperature and salinity, and
may therefore expect trends in relative heat and salt transports
(but difficult to verify statistically based on this time series).
Currently studying whether less variable observations can be
made in an area to the south-west of the FIM section
Ocean Sci., 9, 639-654, 2013
Thank you!
For questions/collaborations, please email b.berx@marlab.ac.uk
The research leading to these results has received funding from the European Union 7th
Framework Programme (FP7 2007-2013), under grant agreement n.308299
NACLIM www.naclim.eu


